| Market Scan Instruction Guide |
|
Back |
|
Download the Set Up files |
|
If you purchased the scan software and have have
not received a licence key
|
|
Setting up OmniTrader to run the SCAN |
|
To get the most out of the SCAN system we suggest you read
the following set up instructions |
|
Even if you are an experienced user you will find this all familiar
however please take the time to review as you may learn some thing and
it will improve your experience in running the SCANS |
Create a new focus list
- "Open" the saved Focus List/profile you downloaded, its called "Market
Scan", this is already in the format you will need.
- Select the shares you might trade, such a ASX 300, or All
Resource Shares.
- You should use this focus list just for the purpose of running
daily scans
- The shares which qualify can be copied
into new focus lists for trading purposes.
- Note if you run all SCANs it will take some time so consider the
number of symbols you include, there is no point in running the
whole ASX if you can not use the data for decisions.
|
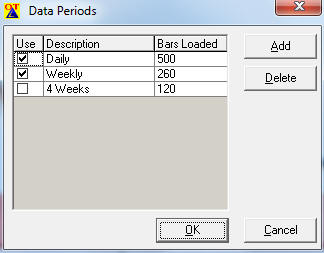
Set up the
periods you want to examine
- go Edit Data Periods and select Daily and Weekly, this
will allow you to analyse the scans in two or more time internals
(you
could add monthly if required)
|
|
|
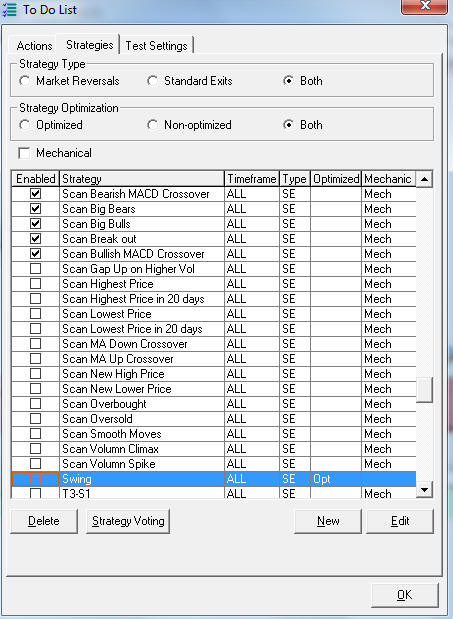
Select the
Scans
- Select the scans you want to run against this list
- Select
the TO DO list - strategies (or go Edit Trading Strategies), you
can select all scans you have downloaded or just those you need as
below
- De select any other strategies in your profile which are not
SCANs ( eg. Trending, Reversals, Breakouts)
|
|
|
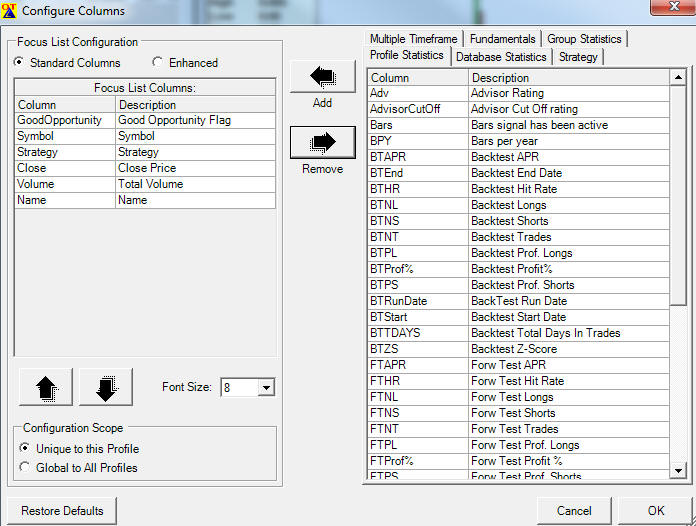
Modify the focus list
- +++++ only required if you did not down load the "Market
Scan" profile provided ++++++
- Modify the focus list layout so you see only what you need
(saves confusion), you select the wrench icon (third from the right)
- Then modify your lay out to only show the following columns.
- Remember this is a scan not a schedule of buy sell signals.
|
|
|
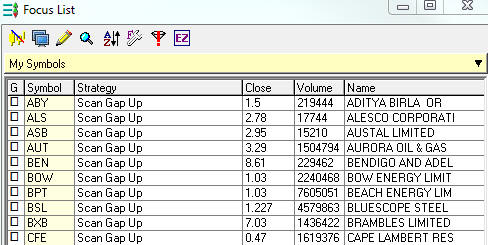
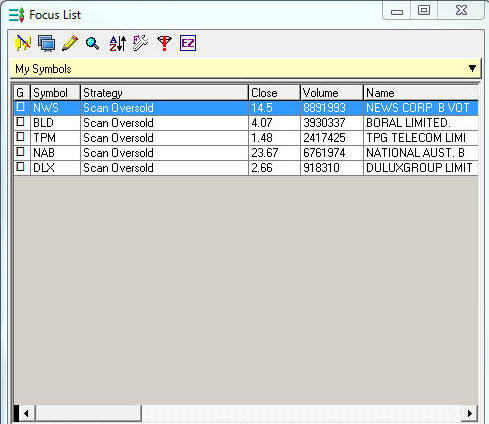
- The result when run will look like this
|
|
|
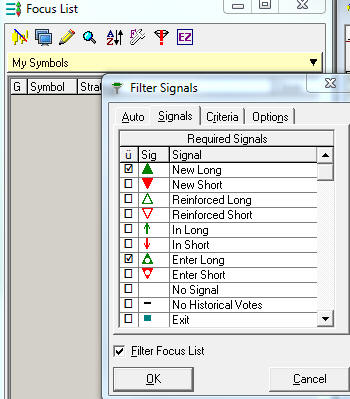
Set up a Filter
so you only see the results
- So that your lists only show shares which pass the scan test,
you will need to filter the list
- Click the filter button on the top of the focus list - see below
it has a red ! mark
in the filter icon because it was already active
- Select New Longs and
Enter Longs then click the filter button at bottom
|
|
|
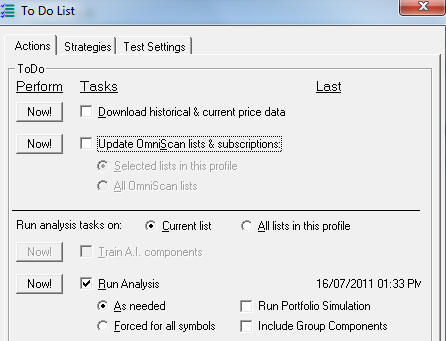
To run the SCAN
- Select the TO DO - select run analysis and
click NOW
|
|
|
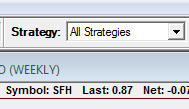
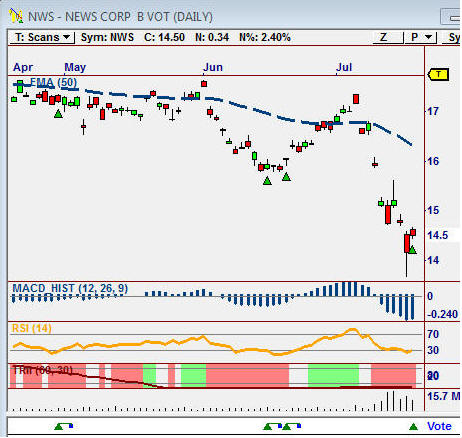
Scan Results
- You can see the results of all SCANs however it is best to review the results
of each scan one at a time, you should use the drop down
"strategies" button and select the SCAN you wish to review.
- Use the default standard chart.
- You can create your own charts to view the indicators if
required.
- Note the vote line at the base of the chart shows all dates when
this scan was satisfied.
|
|
|
|
Example |
- This example is a scan of "Gap Oversold" with the time
frame set a daily
- On the vote line you can see all cases when the scan condition
was satisfied
- Its the most recent vote which triggered the signal
- This "signal" on the vote line should not be read as a "buy or sell"
- its just when the scan condition was satisfied
- Remember to Select the Scan chart template to help you read
the chart
|
|
|
|
|
|
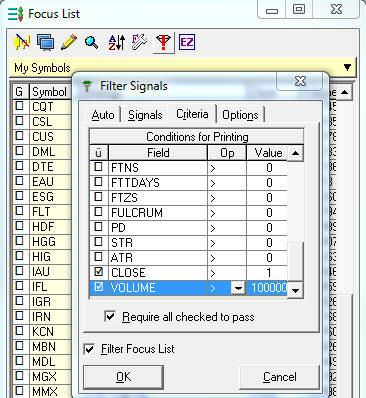
Additional
Filters |
- Often you will find that to many shares satisfy the scan, so if
you want to reduce the list further, you can use the Filters built
into a focus list for such items as Price and Volume.
- The following is an example of setting Price > $1 and
Volume > 100000
- Ensue you tick the boxes shown in example
|
|
|
|
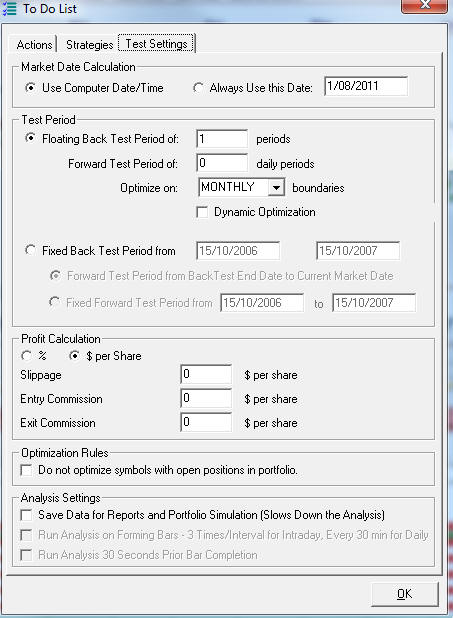
Speed up the
Analysis |
- OT can become slow if you have large numbers of shares to
examine with all scans turned on so ensure your settings look like
the following
- Make changes to test periods, and analysis settings
|
 |
|
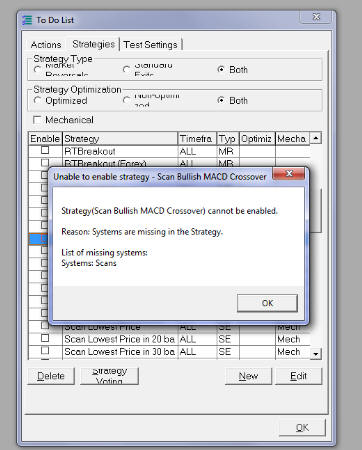
Common Error |
- If you get the following error on running the Scans - it will be
because you did not save your licence file correctly
|
 |
|
More Information |
|
If you would like to understand more about how filters work with
strategies then review this link |
|
|