| Market Scan Module |
|
Market Scan
Module provides you with a similar product as that
offered by Nirvana US OmniScan
|
Market Scan developed by
Corporate Doctor can be run on all Australian and US lists where Nirvana
OmniScan is not available.
Whilst the Scan results are not
signals, they will provide prospects for you to examine further.
- Scans can be run on daily or weekly
charts
- The focus list will show only shares
which meet the criteria
- The Charts show all previous scan
results
Use the scan results too improve your lists before you run
your strategies - just copy and paste shares into a new
list |
 |
|
Example of SCANS available |
|
Scans provide opportunities - do not use them as Buy/Sell signals
without confirmation |
Opportunity |
Indicators within the scan |
|
|
|
|
|
|
|
Scans based on
Price/Volume only |
|
|
|
|
Closing Price above - the 20 period exponential moving
average |
|
Price |
13 |
|
Closing Price below - the 20 period exponential
moving average |
|
Price |
14 |
|
Gap Up—Scans for stocks that show an opening gap up from prior
day high |
|
Price |
15 |
|
Gap Down—Scans for stocks that show an opening gap down from
prior day low |
|
Price |
16 |
|
Highest Price — Highest High over
last year |
|
Price |
17 |
|
Lowest Price - Lowest Low over
last year |
|
Price |
18 |
|
Highest Price in 20 bars
|
|
Price |
19 |
|
Highest Price in 30 bars
|
|
Price |
20 |
|
Lowest Price in 20 bars |
|
Price |
21 |
|
Lowest Price in 30 bars |
|
Price |
22 |
|
Volume Climax— steady increase in volume, followed by a steady
decrease over several bars
|
|
Vol |
24 |
|
Volume Spike - stocks where the Volume spiked on an individual
bar |
|
Vol |
25 |
|
Below 50 day Moving Average with Volume up 150% over last 3 days
average |
|
SMA < 50
Vol |
26 |
|
MA Down Crossover - Short term cross down over longer term MA -
direction turning up |
Longs |
SMA 10 & 30 |
9 |
|
MA Up Crossover - Short term MA crosses up over long term MA -
direction turning down |
Shorts |
SMA 10 & 30 |
10 |
|
|
|
|
|
|
Technical
Scans |
|
|
|
|
Bearish MACD Crossover- Stocks where MACD falls over 5 days |
Shorts |
MACD <0 |
1 |
|
Bullish MACD Crossover- Stocks where MACD rises over 5 days |
Longs |
MACD >0 |
2 |
|
Overbought (and Turning)—Scans
for stocks with falling prices after a bullish run |
Shorts |
MACD > 0, RSI > 70 |
3 |
|
Oversold (and Turning)
—Scans for stocks with rising prices after a bearish run |
Longs |
MACD <0, RSI <30 |
4 |
|
RSI above 70 (indicates over bought) - single indicator |
Shorts |
RSI > 70 |
5 |
|
RSI below 30 (indicates over sold) - single indicator |
Longs |
RSI < 30 |
6 |
|
Big Bears—Stocks that have been
falling for an extended period of time
|
Longs |
MACD < 0, TRII < 20, EMA < 50 |
7 |
|
Big Bulls—Stocks that have been
rising for an extended period of time |
Shorts |
MACD > 0, TRII >80, EMA >50 |
8 |
|
Trending Up - stocks which have started to trend up |
Longs |
MACD > 0,
TRII > 20 SMA > 20 |
11 |
|
Trending Down - stocks which have started to trend down |
Shorts |
MACD < 0,
TRII < 80, SMA <20 |
12 |
|
Smooth Movers—Scans for traded
stocks that do not GAP often over 150 bars |
|
ATR < 0.5 |
23 |
|
|
|
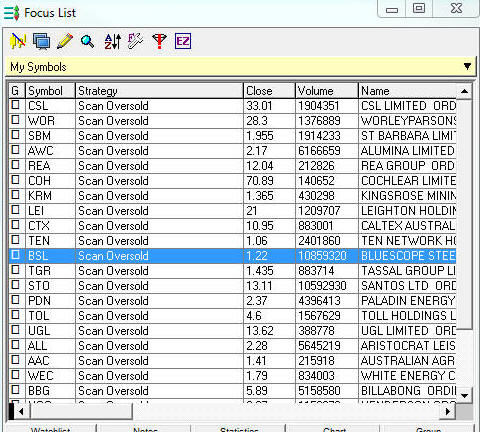
Example of Scan results |
- This shows the scan results for today based on a "weekly" time
frame you could also select a "daily" time frame.
- The right most signals in the chart are what triggered the
results,
- You can also see
the other dates the scan results would have been satisfied
- Use the "strategy" drop down box to look at the results of each
scan.
|
 |
|
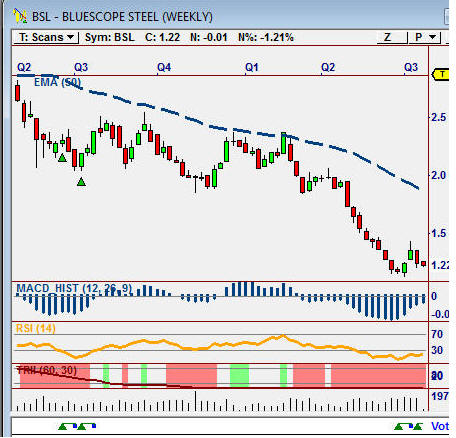
The Scan chart provided with the
module looks as follows - this can of course be changed |
 |
|
User Guide |
|
Learn how to
set up the Scans |
|
|
|
|
|
|
|
|
|
|