| VisualTrader Examples |
|
Outline
Video
Tour
Features
Screen Examples Add
On Modules
Buy Now |
    |
|
Get a copy of the Maps for the Australian
Market
More information
on options (transforms) available |
|
Australian Market Examples |
 |
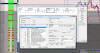
industry list sorted by biggest move since prior day |
 |
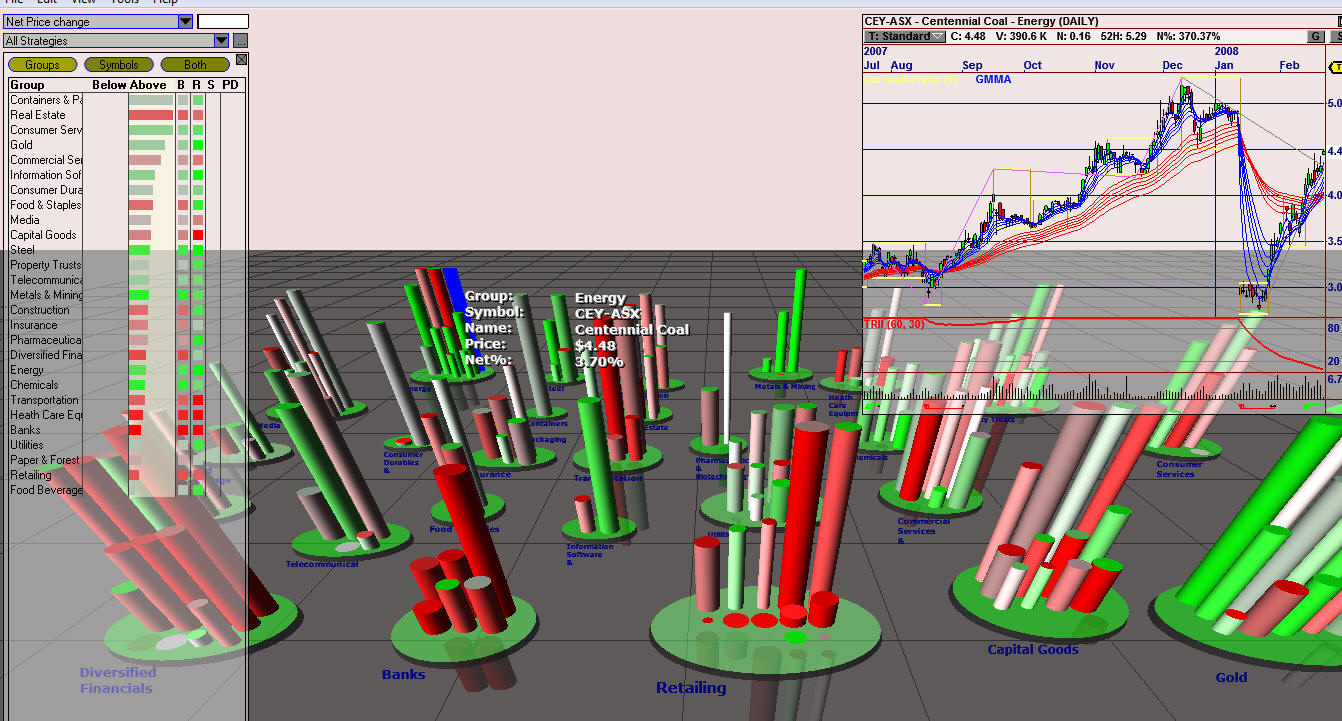
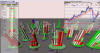
map showing symbols by industry, with chart for a bank and
cylinders for the bank group - showing price moves since previous day |
 |
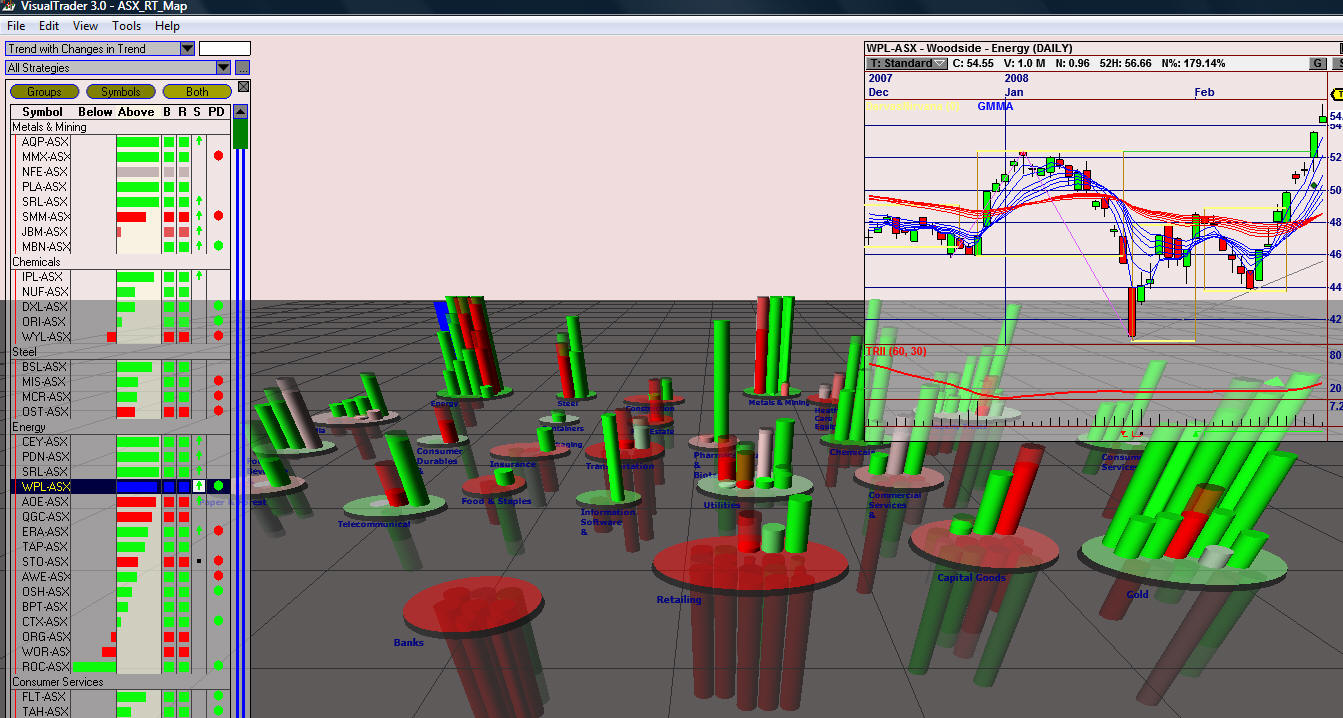
map showing the transform - "trend with changes in trend" - sorted by
industry |
 |
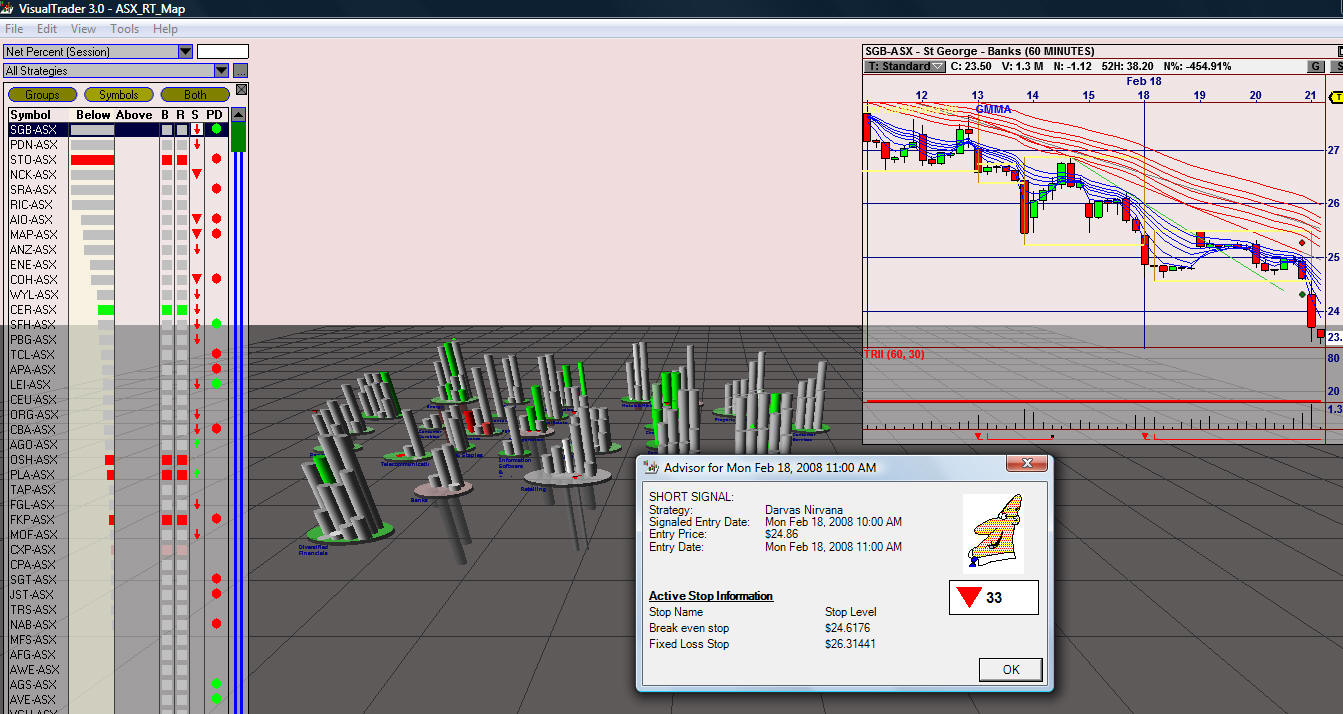
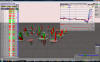
list sorted by symbol - with biggest falls during the
day - this is updated by the minute - note the advisor information
suggesting the short position |
 |
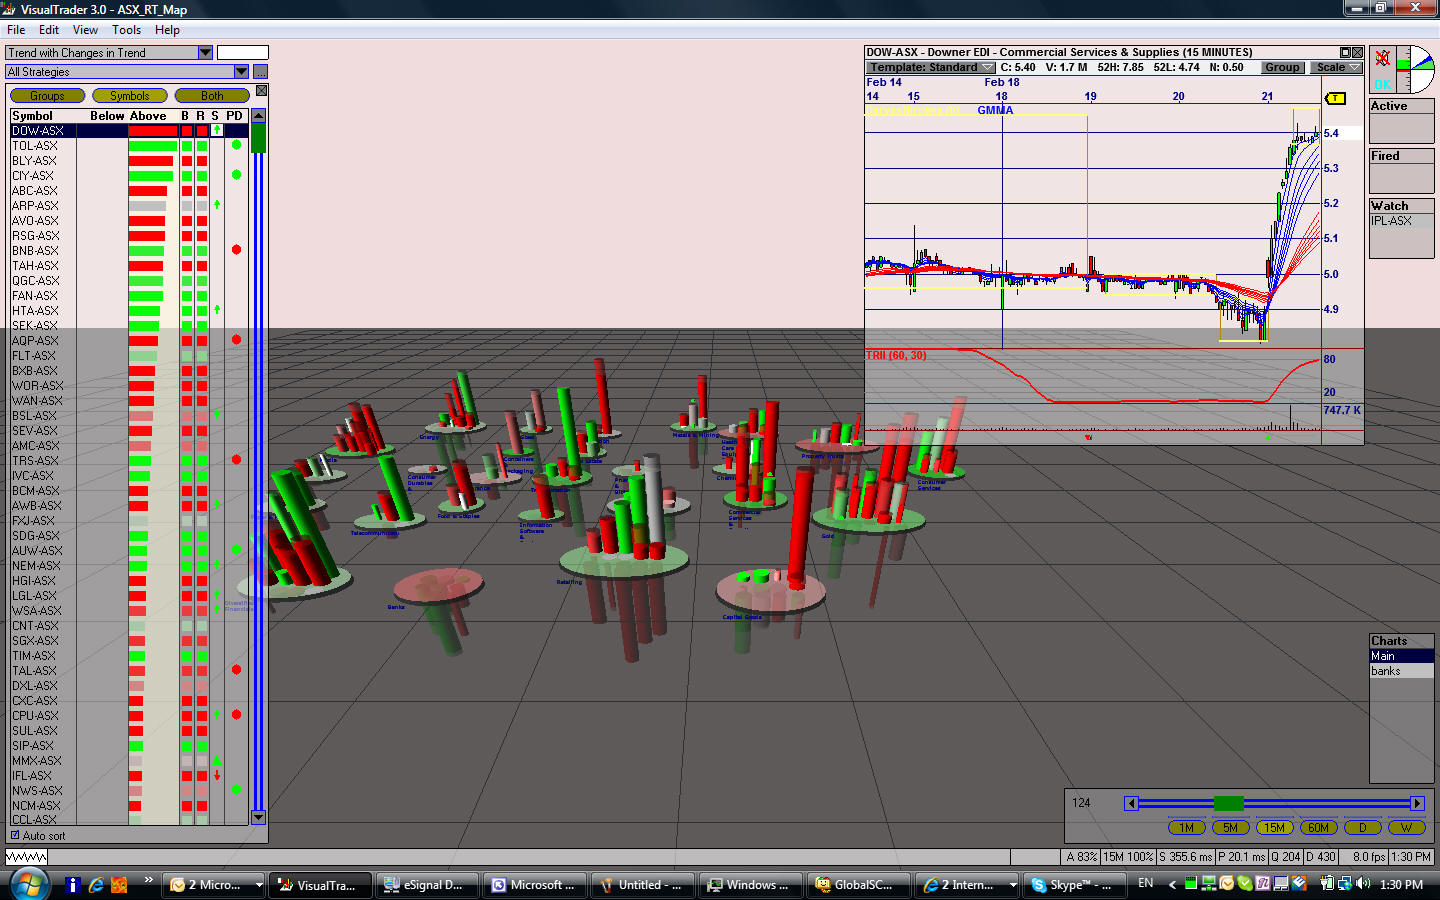
transform "Trend with changes in Trend" - opportunity list sorted with
biggest change |
 |
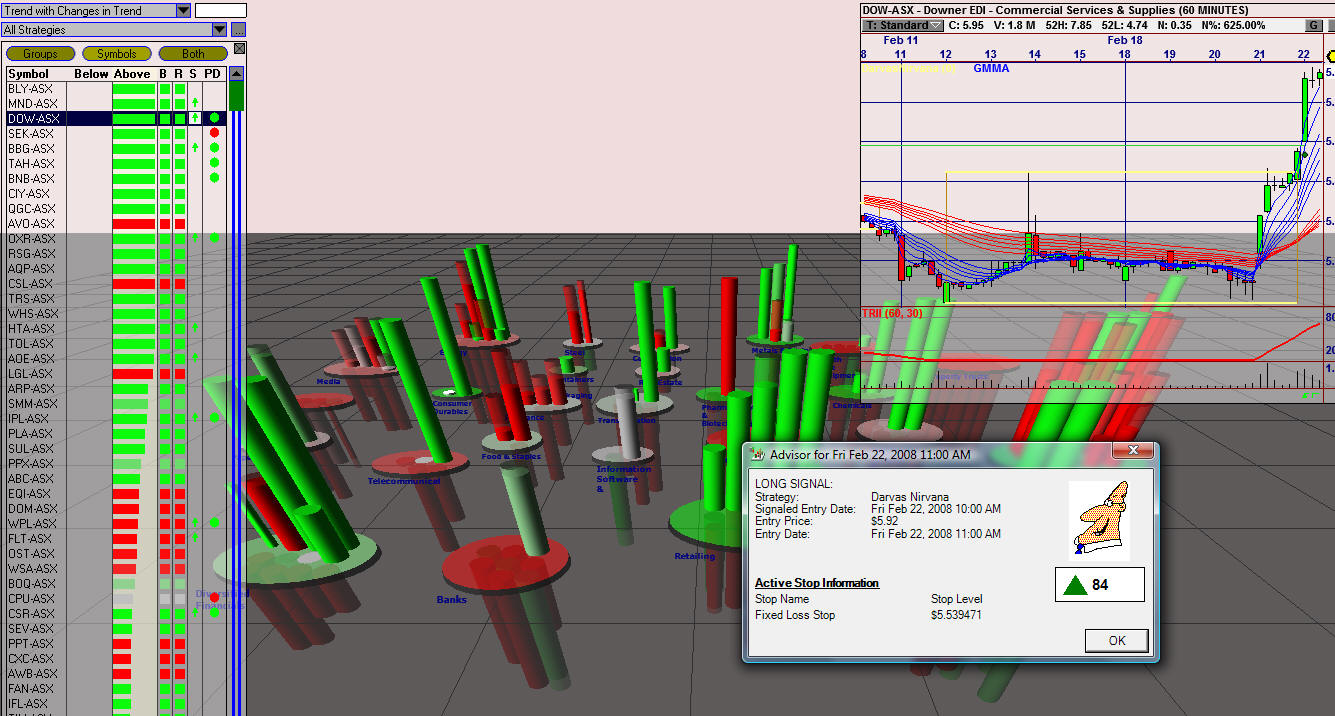
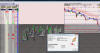
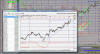
review the chart showing a break out - with advisor rating and suggested
stop loss position - this signal is confirmed with a pattern |
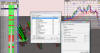 |
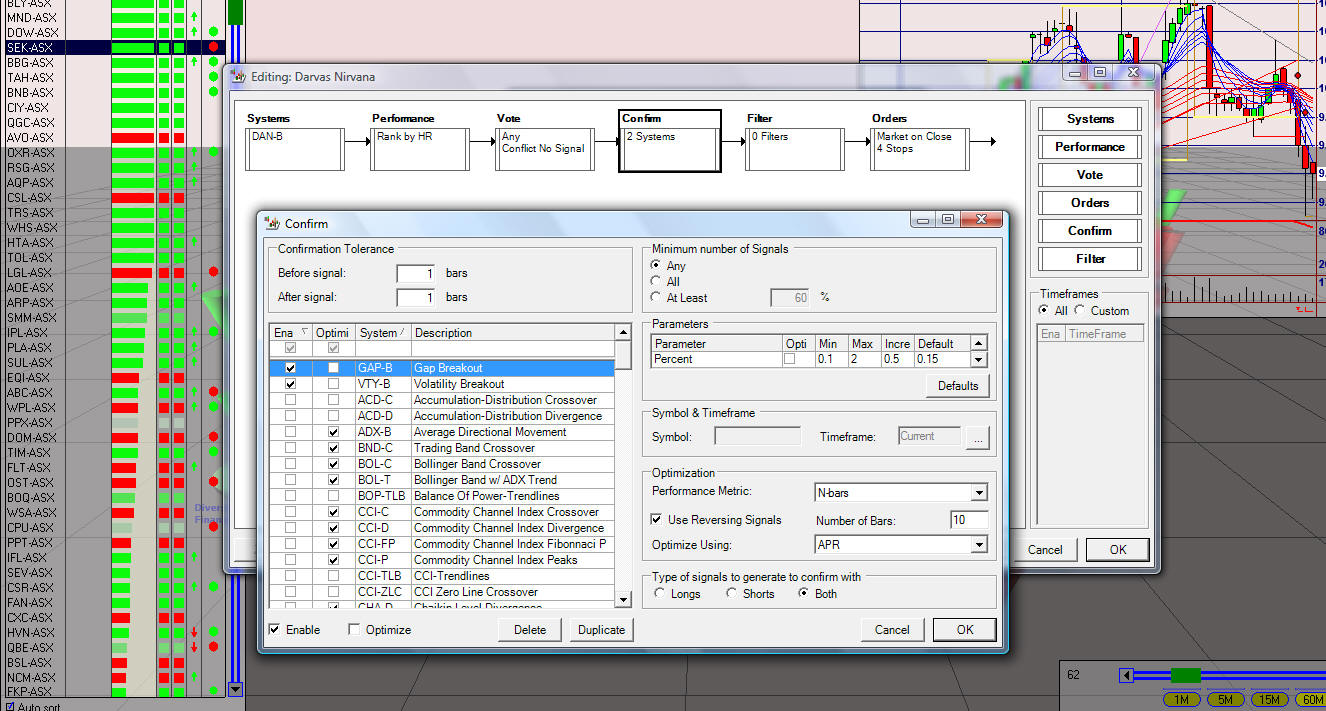
select the strategies you want to run against your watch list and how
you want the system to vote the strategy results |
 |
review all the voting systems used within VT and modify and test your
own set ups (optional) |
 |
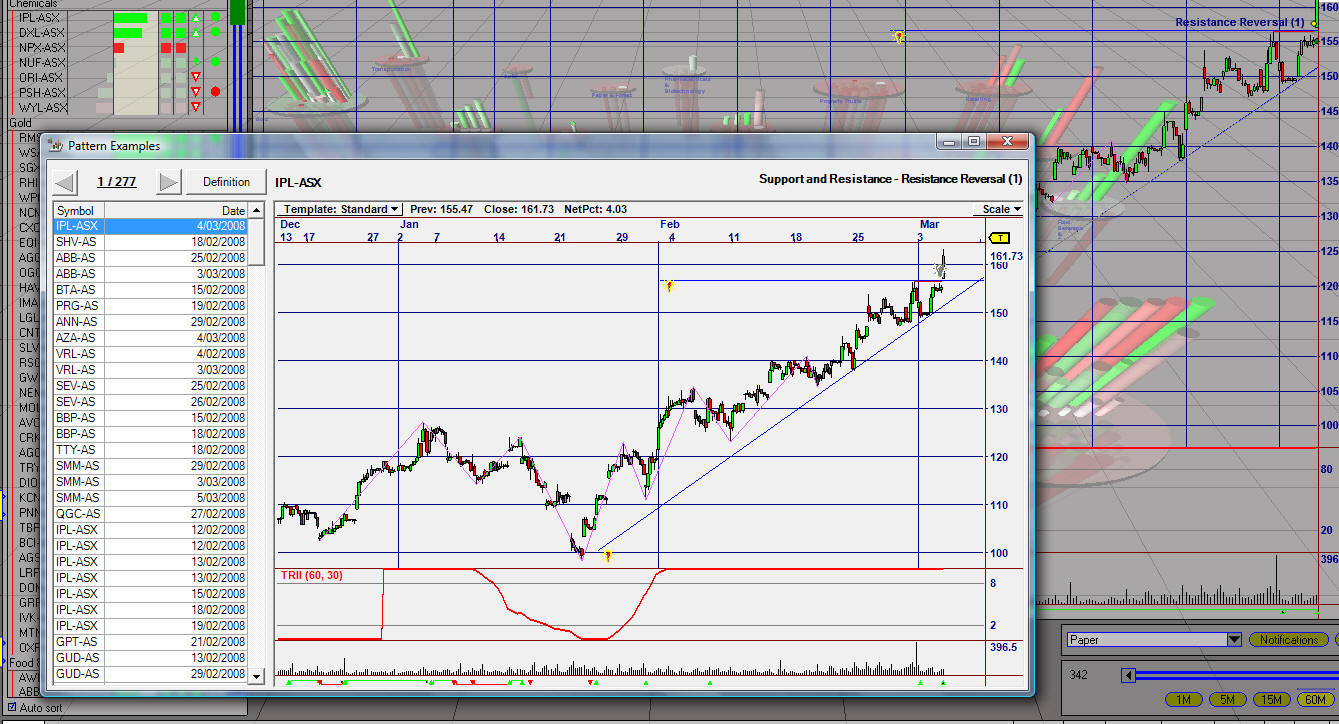
the chart pattern tutor add on module has been activated - example shows
all the sample chart pattern (support /resistance ) for all other cases
within the data base |
 |
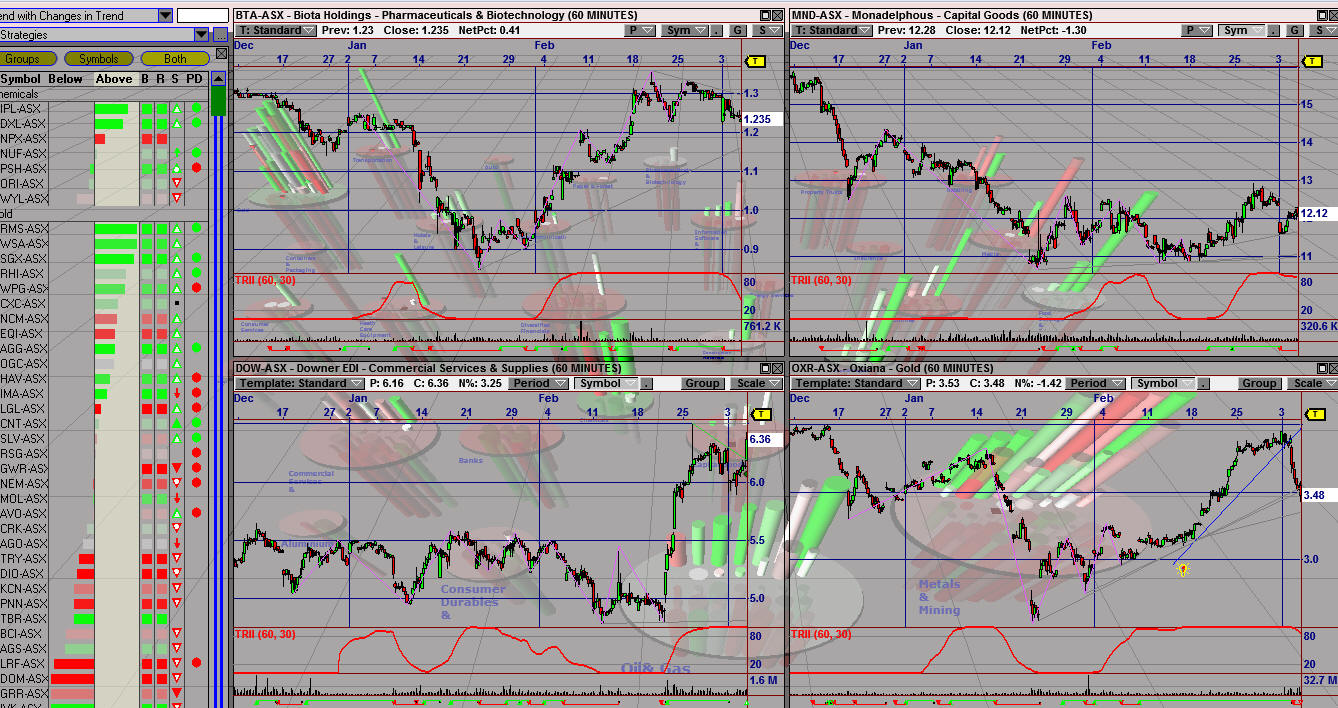
shows example of how multiple charts can be watched at the same time |
|
|
|