But there is another indicator that we use in our strategies because it gives more than just directional information. The Trend Intensity Index (TRII) is a versatile indicator that can be used to determine trend direction AND trend strength.
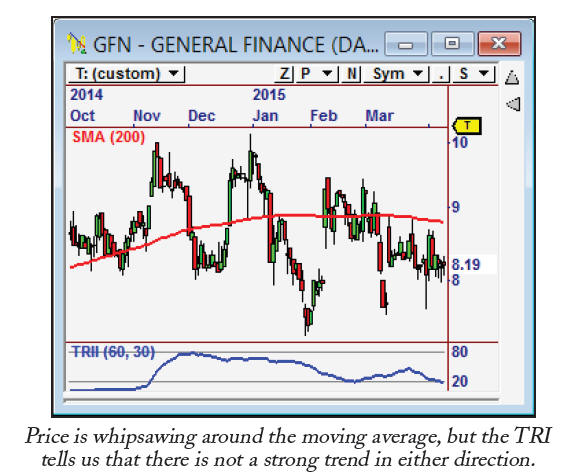
The Trend Intensity Index uses a moving average, but it looks at price distribution around the moving average to help determine trend strength. The classic interpretation of the indicator is that the trend is considered bullish if its value is above 80, and the trend is considered bearish if the value is less than 20. If the indicator is between these values, then we have a non-directional market.
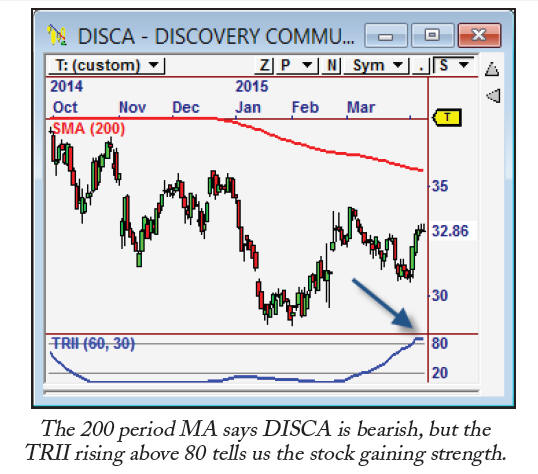
We can also gain information by looking at the direction of the indicator. For example, if it is decreasing, the bullish trend is considered to be weakening. We can also look for it to move from extremes as an early indication that the current trend could be changing or temporarily pausing. Information like this makes the Trend Intensity Index a multi-faceted tool and a powerful addition to any trader’s arsenal.