1. Introduction
-
Background
-
Linking Financial Strategy to Value
-
The Economic Profits Process
2. Concepts
-
Separating Finance from Operations
-
The du Pont Model
3. Return on Capital
-
An Overview
-
NOPAT - (Net operating profit after tax)
-
Capital Employed
-
The Formula - Return on Capital (r)
-
Conclusions
4. Cost of Capital (c*)
-
Overview
-
The Cost of Debt
-
Cost of Equity
-
The Market Risk Premium
-
Measuring Risk
-
Calculating the Cost of Equity Capital (e)
-
Calculating the Cost of Debt (d)
-
Calculating the Weighted Cost of Capital (c*)
5. Economic Profits (EP)
-
Overview
-
How do you calculate EP
-
Cash flow based
-
Performance measure.
-
Links to long term value
-
Value drivers
-
The Importance of Profitability
-
Maximising EP or Maximising the Return?
6. EP - As a Valuation Methodology
-
An Overview
-
Market Value Added (MVA)
-
An Example of an EP Valuation
7. Cash Flow
-
Overview
-
Single Bank Account Cash Flow
-
Accounting Standard Cash Flow
-
Net Cash Flow
-
Operating Cash Flow
-
Free cash flow
8. FCF as a Valuation Methodology
-
Overview
-
An Example of an FCF Valuation
-
Conclusion: Use EP/MVA to support the DCF valuation
9. Examples of Use of EP for Decisions
-
Operational
-
Strategic Planning
-
Specialised Use
10. Value Based Management Accounting
-
What is the purpose of value based accounting
-
Basic principles of value based accounting
-
Adjustments to GAAP accounts
11. Value Based Framework
-
Capital
-
Net operating assets
-
Operating profits
-
Financing costs
-
Retained profits
-
Operating performance
-
Financing
-
Operating and financing
-
EP - Economic Profits
-
MVA Market Value Added
12. Converting financial statements
-
Revenue in advance
-
Provisions
-
Research and development costs (& other intangible investments)
-
Unusual non-recurring gains/losses
-
Goodwill
-
Operating leases
-
Provisions for deferred tax (and future tax benefits)
-
Revaluation reserves
-
Foreign exchange fluctuations reserve
-
Depreciation
13. EP and Capital Project Evaluation
14. Implementation of EP in a Company.
EVA = Economic Value Added and MVA= Market Value Added - are copyright by Stern Stewart
1. Introduction
Across industry managers are pulling in one direction and shareholders are pulling in another. Managers are trying to maximise earnings. Investors want them to maximise cash flows.
Since investors hold the purse-strings, what they want should ultimately be decisive, but if they really are asking for something different from managers, then the message seems to be only slowly sinking into managers' heads. If it is accepted, it could fundamentally change the way manager�s look at their businesses.
Business is driven by information and incentives. If managers produce monthly and annual reports that focus on profits, and if the rewards they receive are based on profits, then it is profit that will determine all their business decisions.
If you want managers to focus on cash, you have to change the reporting and reward systems so that they focus on cash. Probably less than say one quarter of the companies have so far accepted the view that cash is what matters. And there is a huge gap between absorbing the message and changing the way you run the business.
Often the only way to get clients to pay attention to cash impacts is to explain to them what the effect it would have on the share price. One theory that explains precisely this effect on share price is shareholder value analysis (EP). The essence of EP is the idea that share prices reflect the market's estimate of the present value of the future cash flows that a company will generate.
In calculating this figure, analysts look at seven key 'drivers':
-
Turnover growth rate (%)
-
Profit margin (%)
-
Cash tax rate (%)
-
Working capital/sales (%)
-
Capital expenditure/sales (%)
-
Cost of capital (%)
-
Value growth duration period (years).
The last of these items needs some explanation. It represents the future period for which the company has a foreseeable competitive advantage. For example, the company may depend on a product that is expected to hold its place in the market for, say, another four years. After that, it will need a new product. So its 'value growth duration period' is four years -- unless it can persuade the market now that it will have that new product when it needs it.
Investing institutions say they regularly use free cash flow as a basis for appraising companies. The main reason for this, no doubt, is that -- if investment theory is right -- this is what they should always have been doing.
But they have apparently been pushed further in this direction in recent years by lack of faith in published earnings figures, which are thought to be too easily manipulable by company management.
If managers really are out of touch with what investors want, why are they? Part of the reason may be historical: investors used to pay more attention to earnings. But managers are also misled by the fact that some brokers (still) and the press -- and therefore the public generally -- still concentrate on profits and losses.
Also, changing the basis on which you look at your business is always an unattractive prospect. People get used to doing things in a particular way, and change is costly. EP will analyse the proportions in which a particular company's seven drivers contribute to its share price. This enables it to predict the effect on the share price of changing any one of the drivers.
Based on this, for example, if you can get your turnover growth rate up by x% and your cash tax rate down by y%, then your share price should rise by z%. That's the easy bit. The tricky bit, of course, is: how do you do it?
The answer should come from our global best practice, as well as from a company�s own experience. This will tell a company where and how its performance can be improved. It�s also critical to link managerial incentive schemes with the achievement of shareholder value.
The directors' attitude has to be that expressed in the words of Coca-Cola's late Robert Goizueta: 'I get paid to make the owners of the Coca-Cola Co increasingly wealthy with each passing day. Everything else is just fluff.' EP will not work for all types of companies. To take an obvious example, banks do not have a turnover figure; so some modification is needed there. It would also be difficult to apply the seven-driver EP model in companies where, typically, accounting information tends to be of less value anyway: for example, oil companies, investment companies, and businesses that make their money by doing a relatively small number of big deals.
Value Based accounting via EP offers companies a cash-based perspective on life that matches that of the investors who own them. Earnings are dead.
1.2 Linking Financial Strategy to Value
In the past, management has formulated and introduced a strategy and then attempted to measure its impact. This approach has largely been influenced by the fact that a suitable strategy valuation technique has not been available in a simple and meaningful format. The challenge now is to use performance measurements, which can be integrated throughout the process of formulating strategy. It can help establish criteria for selecting the correct strategy using sensitivity analysis to determine which variable, will maximise value creation.
The concept of shareholder value will be explained with a view to examining how cash flows ultimately form the foundation for returning dividends to shareholders or add real value to their investment. The shareholders/owners are always the residual claimants who need to be satisfied with suitable returns. Without this the business entity is no longer viable and is not likely to continue as a going concern. As value is destroyed so is the concept of the going concern.
We need to identify, through performance measurements, how strategy can also destroy value. The implementation of the correct strategy valuation technique must be introduced long before the impact is realised.
1.3 The Economic Profits Process
Economic Profits (EP) is a process for measuring overall corporate performance based on the total cost of capital employed in the business. Increasing shareholder value should be a fundamental strategic goal of all companies. Stern Stewart trademarked this approach and for this reason we will use the term Economic Profits as an alternative descriptor.
EP provides a means of measuring the achievement of that goal at all levels of the organisation. Essentially a tool for measuring value creation, EP is superior to other measures because it:
-
Shifts management's attention away from the short-term thinking driven by traditional accounting conventions by stimulating a longer-term focus on creating real economic value for owners.
-
Simplifies, focuses and integrates decision making with a single measure that provides powerful incentives to managers as they set goals, evaluate performance, select strategies, allocate capital, price acquisitions or measure bonuses.
-
Aligns business strategy with the goal of maximising economic value.
-
Provides a tool for integrating shareholder value into strategic and operating decisions; in this sense, it links operations and finance.
-
Aligns overall organisational performance measures used by senior executives with strategy and with business processes.
-
Creates a small, balanced family of measures that address cost, quality, and timeliness across the organisation, its processes, and its people.
-
EP is the only cost measure that takes into account the total cost of an operation's capital. Only by accounting for all costs can a company ensure that it is adding value to the company.
-
Studies have shown that share prices track EP more closely than they track other common measures such as earnings per share or return on equity.
-
When EP is tied to compensation through bonuses or share incentives, it can spur improvement without the downside risk of encouraging managers to "aim low," as is the case with such targets as percentage rise in operating earnings.
-
Using EP communicates throughout the organisation that shareholder value is the goal and efficient use of capital is the way to achieve it.
-
Because EP can be measured at each level of the organisation, it is an ideal basis for management compensation.
2. Concepts
2.1 Separating Finance from Operations
Financial statements are normally prepared in a format, which complies with accounting disclosure requirements. Unfortunately, this format does not distinguish between finance and operations.
2.1.1 The Traditional Approach
Most financial statements reflect a format consistent with the following formula:
EQUITY = (Current assets - Current liabilities) + Non current assets - Non current liabilities.
The debt financing components are included in current liabilities and non-current liabilities, as follows:
|
|
$ |
$ |
|
Accounts receivable |
|
10,000.00 |
|
Inventories |
|
20,000.00 |
|
Pre-payment |
|
1,000.00 |
|
Cash at the bank |
|
5,000.00 |
|
|
|
36,000.00 |
|
Less |
|
|
|
Accounts payable |
10,000.00 |
|
|
Accruals and provisions |
6,000.00 |
|
|
Bank overdraft |
10,000.00 |
26,000.00 |
|
Net working capital |
|
10,000.00 |
Working capital is shown as $10,000, based on traditional measurement. The challenging question is whether or not the cash and the bank overdraft should form part of the operating working capital, or how much is the normal requirement for working capital management.
2.1.2 Valued Based Financial Analysis
Financial analysis demands a change in the format by separating all funding components from operating components. The following format needs to be considered:
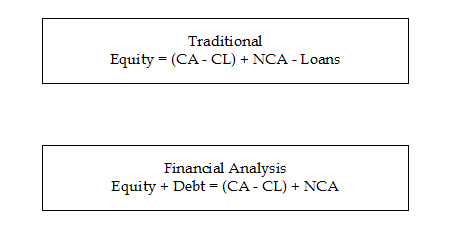
EQUITY + DEBT = (Current assets CA - Current Liabilities CL ) + Non current assets NCA
In essence all funding is removed from the operating side of the equation. The net working capital computed above is redefined by removing the cash on hand and at the bank and the bank overdraft and debt (LOANS) from the right hand side of the equation.
Separate Finance from Operations
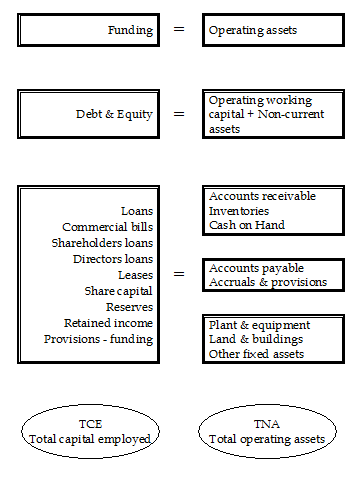
Revised working capital assuming cash is needed for operations would be:
|
Current assets |
36,000.00 |
|
Current liabilities |
16,000.00 |
|
Net operating working capital |
20,000.00 |
This provides a
different picture. The same principle would apply to all
forms of funding. This means that the end result would give rise to the
following format:
DEBT + EQUITY = WORKING CAPITAL + NET NON CURRENT ASSETS
The funding process
The following sequence of events ties together the operating and finance approach:
-
A company raises a mix of debt and equity.
-
The funds are then invested in operating assets (working capital and non-current assets).
-
The business begins to generate sales and incurs operating expenses and taxes.
-
The funds remaining in the form of net operating profit after tax but before interest (NOPAT) are available for distribution to financiers of both debt and equity.
-
Lenders receive interest as a reward while shareholders receive dividends and capital growth.
The point is that whatever the business can earn from investing in net operating assets must be the total cash available to reward those who supported the initial mix of debt and equity. Investors remain at last call.
This implies that if management can manage the net operating assets effectively to maximise return then investors can be rewarded. The net operating profit after tax but before interest (NOPAT) reflects the separation of funding from operating concepts. This introduces the interface between the Profit and Loss and the Balance Sheet based on the matching concept.
The message is that changes, which occur in the mix of debt and equity, have no impact on the operating performance of the business. Leverage strategy needs to be separate from operating strategy, both being equally important.
2.2 The du Pont Model
Lets look at the various financial models available for financial analysis.
The first to consider is the basic du Pont model which applies the separation of finance from operations. It has three primary components.
2.2.1 Profitability
|
Profitability% |
= |
Profit before interest and tax (PBIT) |
|
|
|
Sales |
This measurement represents the operating performance of a business entity
expressed as a return on sales. It also provides a measurement of operational
efficiency in the Profit and Loss Account, void of finance costs.
2.2.2 Activity
|
Activity |
= |
Sales |
|
|
|
Total Net Assets |
This measurement reflects Balance Sheet efficiency in terms of the utilisation of scarce resources. A factor of 2.50 means that for each $1.00 invested in total net assets (void of funding) sales have been generated of $2.50. For example as sales decrease and total net assets increase, activity will decline indicating a less efficient utilisation of scarce resources.
2.2.3 RONA - Return on Net Assets
RONA is a dynamic measurement, which integrates the activities of the Profit and Loss and Balance Sheet in one calculation.
|
RONA |
= |
PROFITABILITY x ACTIVITY |
|
RONA |
= |
PBIT
x Sales |
|
RONA |
= |
PBIT |
RONA provides a measurement of the operational return on the investment in TNA. This is also the return on capital employed (ROCE) or the return on investment (ROI) due to the equivalence concept derived from separating finance from operations.
RONA would have to at least equal the weighted cost of borrowing to avoid reverse leverage taking place.
This is the erosion of equity as a result of too little PBIT being generated
to service the cost of borrowing. 
Limitations of the du Pont Model
-
It is a short-term measurement.
-
A before tax measurement.
-
Setting a target for a good RONA is difficult.
-
It does not link to the cost of capital.
-
It does not link to the time value of money.
-
It does not link to value
3. Return on Capital
3.1 An Overview
Return on capital further assumes the above concepts but takes account of the impact of taxation as a cost of doing business. The components of computing a return on capital need to be defined carefully.
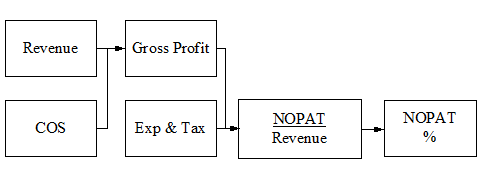
3.2 NOPAT - (Net operating profit after tax)
NOPAT is an operating performance measurement after taking account of taxation but before financing cost (interest).
NOPAT requires further adjustments for non-cash accounting entries. It is important to note that depreciation is an exception to this rule. Depreciation is an exception because depreciable non-current assets are subject to wear and tear and have to be replaced. The adjustments made are known as equity equivalents, which are applied in the calculation of NOPAT. The result is that NOPAT provides a more realistic measurement of the actual cash yield generated from recurring business activities.
NOPAT is basically EBIT adjusted for the impact of taxation. The purpose of this is to arrive at taxation on operating income, which is then deducted from EBIT. Interest is totally excluded, as the concept of separating finance from operations must be taken into account.
The format for computing NOPAT is as follows:
|
Profit before interest and tax (EBIT) |
|
X |
|
Equity equivalent adjustments/reversals: Adjusted EBIT |
|
|
|
Less Cash Taxes (adjusted taxation): |
|
|
|
= NOPAT |
|
X |
This formula aims at calculating the operating net profit after �cash operating taxes�.
|
NOPAT |
= |
NOPAT % |
|
Revenue |
|
|
The NOPAT% is the return on revenue and represents the first component of return on capital.
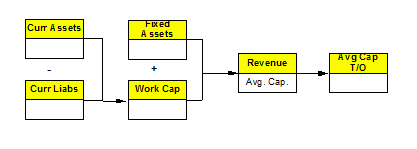
3.3 Capital Employed
Capital employed consists of a mix between debt and equity funding.
Based upon the concept of separating finance from operations we will remember
that:
|
Debt & Equity |
= |
Net Operating Assets |
The return on capital employed is also the return on operating assets. The capital employed needs to be adjusted to include any equity equivalents. The result of these adjustments is to �gross up� the capital employed to reflect the economic investment in the business.
Some common equity equivalent adjustments are as follows:
-
Goodwill amortised.
-
Provisions for stock losses (if material)
-
The present value of leases not capitalised.
-
Research and development written off (if applicable).
-
Provision for bad debt (if material).
-
Interest capitalised on balance sheet.
-
Deferred income tax reserves.
-
Cumulative unusual losses or gains.
-
Deferred income reserves, less FITB.
The capital employed as reflected in the financial statements needs to be adjusted by including equity equivalents (cumulative) with the period-to-period changes being taken into NOPAT. These adjustments convert capital into a more accurate measure of the base upon which investors expect returns to accrue.
Capital turnover can now be measured by applying the following formula:
|
Revenue |
= |
Average Capital Turnover |
|
Average Capital Employed |
|
|
Other calculations could be based on opening capital or closing capital.
This is the second component in the computation of return on capital. The above explanations aim at illustrating the importance of equivalence between the financial sources and operating uses of capital; and between the NOPAT that is earned in the business and the cash that is available to reward all of the entity�s financiers.
3.4 The Formula - Return on Capital (R)
|
R |
= |
NOPAT |
|
|
|
Capital |
Or
|
R |
= |
NOPAT % |
X |
Capital Turnover |
|
|
|
|
|
|
|
R |
= |
NOPAT |
|
Revenue |
|
|
|
Revenue |
X |
Capital |
Return on capital in its final form is really the economic return on capital because it measures the cash return in the form of cash profits on the capital invested by stakeholders.
EcROCE% = NOPAT% x Average Capital Turnover
This provides a measurement of the productivity of capital employed. Some business entities use opening capital instead of average capital because they are dependent on Non-current Assets where the investment will take time to generate cash returns.
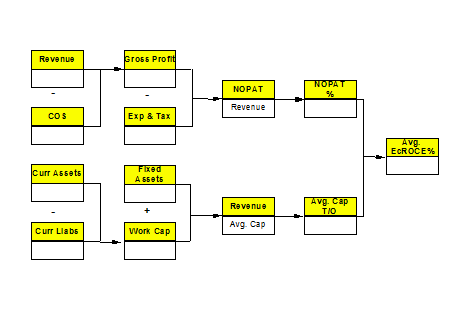
In summary EcROCE% can be defined as a return on capital employed (average or opening) regardless of the financial forms in which capital has been obtained. It is a measurement of the productivity of capital employed.
Example - EcROCE
EBIT = 390
Taxation = 152
Decrease in deferred tax = 10
Goodwill opening Provision = 50
Goodwill amortised = 50
Marginal corporate tax = 40%
Interest = 70
Opening capital = 1,450
Closing capital = 1,950
Revenue = 1,500
Step One - Calculate NOPAT
|
EBIT |
|
390 |
|
Add Goodwill Amortised |
|
50 |
|
|
|
440 |
|
Less Taxation |
152 |
|
|
- Deferred Tax |
10 |
|
|
+ Tax on Interest (.40 x 70) |
28 |
190 |
|
NOPAT |
|
250 |
Step Two - Calculate Average Capital Employed
|
|
Opening |
Closing |
|
Balance Reported |
1,450 |
1,950 |
|
Add Goodwill Amortised |
50 |
100 |
|
Adjusted Capital |
1,500 |
2,050 |
|
Average Capital Employed =
1,500 + 2,050 =
1,775 |
||
Step Three - Calculate EcROCE (r)
|
Calculate EcRoce (r) |
||||||
|
NOPAT % |
= |
NOPAT |
= |
250 |
= |
16.6% |
|
|
|
Revenue |
|
1500 |
|
|
|
|
|
|
|
|
|
|
|
Capital Turnover |
= |
Revenue |
= |
1500 |
= |
0.85 |
|
|
|
Average Capital |
|
1775 |
|
|
|
|
|
|
|
|
|
|
|
R |
= |
NOPAT % x Capital Turnover |
||||
|
R |
= |
16.6% x 0.85 |
|
|
|
|
|
R |
= |
14.11% |
|
|
|
|
3.5 Conclusions
The return on capital employed (EcROCE) provides an after tax measurement of return on investment.
Its strengths are:
-
A clear after tax measurement of operating performance.
-
Can be compared to the cost of capital.
-
Links performance to investment in assets.
-
Used as a component for proven long-term valuation techniques.
Its weaknesses are:
-
May be harder to comprehend.
-
Requires value based accounting treatment.
-
Does not take account of the time value of money.
4. Cost of Capital (c*)
4.1 Overview
Managers need to understand that capital employed in a business entity is not free of cost. The weighted cost of capital provides a mandatory benchmark for evaluating rates of return on new capital projects. It uses the financing side of the balance sheet in the form of the targeted debt to capital ratio, which provides a basis for weighting the cost of debt and equity capital.
The cost of capital is the combined rate of return required by both lenders and shareholders. It is the minimum acceptable return on economic investment as a cut-off rate required for value creation.
The cost of capital has four primary applications:
-
As the discount rate to bring projected free cash flow to its present value.
-
As the capital charge rate for calculating Economic Profits.
-
As a hurdle rate for assessing return on capital employed.
-
As a minimum target rate for accepting new projects.
The cost of capital �drivers� are all about the trade off between risk and reward. The greater the risk, the greater the required return and the cost of capital.
The Cost of capital (also described as WACC - Weighted Average Cost of Capital) is the return on capital employed (NOPAT) required to have sufficient funds to:
-
Pay interest after tax on debt.
-
Provide an acceptable return on equity - Its this equity return that accounts never included.
4.2 The Cost of Debt
The after tax rate the business would have to pay in the current market to obtain new long-term debt capital.
4.3 Cost of Equity
This component of cost of capital is more abstract as it is based upon alternative investment yields of comparable risk. The leading question is how much compensation do investors require over and above the return provided by government bonds to compensate them for bearing the risk. It takes into account the Market Risk Premium (MRP) and Beta (B).
4.4 The Market Risk Premium
Many research organisations have gathered information, which allowed them to compare the annual return from common stocks as against that of long term government bonds (which are Risk Free = Rf changes all the time for example 5% ). The evidence is that investors are compensated for risk to the extent of a 5.5-8% premium over the return from long-term bonds. A market risk premium of 6% is considered as a good base.
|
Expected stock market return |
= |
Risk free rate + market risk premium |
|
Rm |
= |
Rf + MRP |
4.5 Measuring Risk
The MRP must be scaled up or down to reflect the risk of a particular company. Research centres have gathered information since the 1960�s and developed the risk index known as the beta factor (B). This is a technique employed which sets the risk of the market as a whole equal to one.
If a company has a beta factor greater than one investors would consider the investment to be riskier than the market as a whole. If beta were less than one it would reflect a less risky investment than the market as a whole. By multiplying the beta (B) by the expected market return risk premium the risk component is adjusted for.
4.6 Calculating the Cost of Equity Capital (e)
|
E |
= |
Rf + (RIxMRP)
|
|
E |
= |
Risk free rate of return + (Risk index [B]) x (Market risk premium) |
4.7 Calculating the Cost of Debt (d)
D = Cost of borrowing (interest) x (1 - marginal corporate tax rate).
4.8 Calculating the Weighted Cost of Capital (c*)
The weighted cost of capital implies that a weighted average should be calculated for the cost of equity and the cost of debt.
This is simply achieved by estimating the targeted debt and equity mix.
Cost of debt = 6%
Cost of equity = 15%
Targeted debt to equity = 60:40
Debt = 6% x 60% = 3.6%
Equity = 15% x 40% = 6.0%
Cost of capital = 9.6%
The above example illustrates the impact of the mix of debt and equity on the cost of capital. This is simply due to the �weighting� process, which provides a true and correct average weighted cost of capital.
Example of full calculation of cost of capital
|
Marginal corporate tax rate |
30% |
|
Long term government bonds |
6.8% |
|
Market risk premium MRP |
6% |
|
Cost of borrowing |
10% |
|
Targeted debt to capital |
40% |
|
Risk index (Beta) B |
1.5 |
* C* = WD + we
Wd = weighted cost of debt
Wd = Borrowing cost x (1 - tax rate) x 40%
= 10% x .70 x .40
= 2.8%
We = *Weighted cost of equity (we)
We = (Rf + [B x MRP]) x 60%
= (6.8% + [1.5 x 6%]) x 60%
= 9.48%
The average weighted = we + WD
Cost of capital = 9.48 + 2.8
WACC = 12.28%
5. Economic Profits (EP)
5.1 Overview
One of the most dynamic performance measurements to account properly for all ways in which value can be added or lost is EP. EP is a residual income measurement, which subtracts the cost of capital from net operating profits after tax generated in the business. Also called EVA = economic Value added.
The calculation zeros in on shareholder wealth by asking a basic question: What is the difference between the cash that investors have put into a business over its life time, and the amount they could get out of it today by selling their shares.
A company borrows money at a certain rate, invests it at a higher rate and pockets the difference. The issue is how much economic value has been added. If a company is making less than its cost of capital then it is not adding economic value.
The larger a company is, the less it understands cash. Earnings are an accounting convention, but cash flow is what is real wealth. Shareholders want cash returns on their capital.
Earnings per share, market capitalisation, return on net assets, net profit etc are all performance measures and all fail to answer the fundamental question �has management increased the capital lenders and shareholders have given it?�
EP is an internal calculation, done on an annual basis, and is the after tax net operating profit minus cost of capital. A positive EP signifies a strong stock.
Maximising shareholder value entails maximising the spread between the Capital invested in the business and the market capitalisation of the business. This spread is called the MVA (Market value added).
MVA (market value added) is a market value comparison that can be done at any time, and is the difference between what investors put in and what they can take out. This is a different measure since it compares share price against all capital contributions a company has received. Positive MVA indicates how much wealth has been created.
MVA is the value the stock market places on streams of expected EP�s.
Maximising shareholder wealth is not the same as maximising the market value of a business. The reason for this is simple: simply investing ever-increasing amounts of capital can increase market value.
Introducing a framework where all the strategy and performance issues are linked to value is the key to value based management.
5.2 How do you calculate EP
You need to know (a) the cost of capital and (b) How much capital is employed and (c) after tax operating profit
Operating profit less tax (before interest) = after tax operating profit
less a capital charge (weighted average cost of capital (debt% equity%) x
capital = cost of capital)
= EP
Positive EP = adding value
Negative EP = destroying value
[The implementation of EP accounting and its rules requires a non-accounting framework. - see following sections]
Assume:
-
A manager has $800,000 of capital allocated to fund the fixed assets and working capital in their business
-
The opportunity cost of the capital is 10% (i.e., for ventures of similar risk, the providers of capital can get a 10% return on their investment).
Then all a manager needs to understand is that to create value, NOPAT needs to exceed the capital charge of $80 000 ($800,000 x 10%).
5.3 Cash flow based
Profit is an opinion. Cash is a fact.
EP is measured using a value based approach to management accounting whereby reported accounting results are adjusted to measure true economic performance. As far as practical, the adjustments convert EP into a cash based measurement.
5.4 Performance measure.
EP tells you how you have done in the past. It also tells you what you need to do in the future to create value.
EP is a superior measure of performance because:
-
Managers are charged for using capital at an appropriate risk adjusted rate
-
Accounting distortions are eliminated as far as is practical
-
Operating efficiency and financing issues are integrated in one measure.
-
It links to value
5.5 Links to long term value
Whether you are capital budgeting or valuing a strategy, there is an important equivalence:
The Net Present Value (NPV) is the same whether discounting EP or cash flows.
There is strong empirical evidence suggesting cash flows and EP correlate with the Market Value Added in a business.
The final piece of the jigsaw can now be put in place.
MVA = NPV of EP�s
= NPV of FCFs (Free Cash Flows)
Clearly it can be seen that maximising EP over the long term will maximise the value of a company.
Although Free Cash Flow links to value, it is not an effective measure of performance. For example: A negative cash flow could mean negative profits, high capital investment or both. Such contradictions make it impossible to evaluate short-term performance using Free Cash Flow. The following examples highlight some of the issues.
Example 1
In this example, a poorly performing business spends capital to improve its performance.
|
|
Current |
New Strategy |
Combined |
Indicator |
|
Capital |
1000 |
1000 |
2000 |
Good |
|
EBIT |
60 |
150 |
210 |
Good |
|
RONA |
6% |
15% |
10.5% |
Good |
|
NOPAT |
40 |
100 |
140 |
Good |
|
EcRoce |
4% |
10% |
7% |
Good |
|
WACC |
12% |
12% |
12% |
- |
|
SPREAD |
-8% |
-2% |
-5% |
Good |
|
EP |
-80 |
-20 |
-100 |
Bad |
|
NPV |
-667 |
-167 |
-834 |
Bad |
|
MVA |
-667 |
-167 |
-834 |
Bad |
The Net Present Value of the new strategy is negative but all the performance
indicators except EP show performance has improved.
This highlights the often-cited example of �throwing money at a problem.�
Example 2
In this example, a strong performer invests capital above the cost of capital (i.e., a value creating strategy), but faces a decline in conventional performance measurements.
|
|
Current |
New Strategy |
Combined |
Indicator |
|
Capital |
1000 |
1000 |
2000 |
- |
|
EBIT |
300 |
210 |
510 |
Good |
|
RONA |
30% |
21% |
25.5% |
Bad |
|
NOPAT |
200 |
140 |
340 |
Good |
|
EcRoce |
20% |
14% |
17% |
Bad |
|
WACC |
12% |
12% |
12% |
- |
|
SPREAD |
8% |
2% |
5% |
Bad |
|
EP |
80 |
20 |
100 |
Good |
|
NPV |
667 |
-167 |
834 |
Good |
|
MVA |
667 |
167 |
834 |
Good |
Because the overall return has dropped measures such as RONA, EcRoce and the
EP spread show a decline. However, the new strategy is Net Present Value
(NPV) positive. On the other hand both EP and MVA show the strategy to be a
good one.
The above examples show the benefits of adopting a financial framework that directly links performance and value.
5.6 Value drivers
Strategies drive value. However, any measurable strategy can be analysed on the basis of its impact on the financial value drivers.
The seven financial value drivers determine the Market Value of any business:
1. Revenue Growth
2. Operating Margin (PBIT%)
3. Cash Taxes
4. Working Capital Investment
5. Fixed Asset Investment
6. Cost of Capital
7. Expected Growth Duration
NOPAT takes into account revenue growth, PBIT% and cash taxes. The Capital Charge takes into account working capital and fixed asset investment levels and applies the cost of capital to them.
For this reason it can be seen that EP takes into account all six financial performance drivers. By performing a valuation over the forecast period implicitly takes into account growth duration (the seventh driver).
The Free Cash Flow approach also takes all the value drivers into account when performing a FCF valuation. It is for this reason that an EP/ MVA valuation and an FCF valuation provide you with the same answer.
Management decision-making should be based around the impact of proposed strategies on all the value drivers. A company may maximise short-term profits by not re-investing capital but this will negatively impact the growth duration driver. Conversely, a company may sacrifice margins in order to build market share. This strategy, if successful, will lift future revenues and possibly extend growth duration.
EP�s advantage is that it is the only performance measurement, which links directly with the intrinsic value of the business.
Economic Profits (EP)

5.7 The Importance of Profitability
The impact of profitability in the form of NOPAT is best illustrated in a simple example.
If we compare two companies X and Y, both earning $2,000 of NOPAT with projected growth of 10%.
|
|
X |
Y |
|
NOPAT |
2,000 |
2,000 |
|
Growth |
10% |
10% |
Company X has more investment opportunities and requires 100% of its NOPAT for
reinvestment while company Y only requires 80%.
|
|
X |
Y |
|
Increase in NOPAT |
200 |
200 |
|
Increase in investment |
2,000 |
1,600 |
|
Return |
10% |
12.5% |
Company Y is more valuable than X because it earns a higher rate on
investment.
The projected growth rate in NOPAT can be calculated as follows:
R x
I
NOPAT
I = Incremental investment or the net increase in capital required.
If a business can produce a return of 20% but we need to invest 70% of NOPAT each year, the growth rate:
= 20% x 70%
= 14%
The above example aims at identifying the importance of increasing profit without having to excessively increase the capital employed in the business.
The Formula
EP = (r - c*) x Capital employed
r = rate of return
c* = cost of capital
Total capital employed = $2,000
C* = 10%
r = 12.5%
EP = (12.5% - 10%) x 2,000
EP = $50.00
|
Where |
R |
= |
NOPAT |
= |
EcROCE% |
|
|
|
|
Capital |
|
|
EcROCE% = NOPAT% x Average Capital Turnover
5.8 Maximising EP or Maximising the Return?
Let us consider the following example:
-
Capital employed at the beginning of the year is $1,000.
-
The business needs to invest a further $2,000 in working capital, which is expected to return 20%. Thereby adding $400 to sustainable NOPAT. NOPAT previously amounted to $250, and will therefore increase to $650.
-
The overall return for the business is 25%. (250/1,000)
-
The cost of capital is 15%.
-
The consolidated return is 22% (650/3,000), which is lower than the 25% achieved in the past. However, EP = (22 - 15%) x 3,000 = $210.
-
Before the expansion EP = (25 - 15%) x 1,000 = $100.
The above example indicates that the �%Return� can decline but $EP in fact increases. This emphasises the view that $EP is more important than maximising a %return.
6. EP - As a Valuation Methodology
6.1 An Overview
Many businesses have mission statements, which state that their major objective is to maximise shareholder wealth. How this mission should be achieved is much less certain.
Firstly, how are returns to shareholders measured? Generally, these are represented by returns to shareholders via dividends and increases in the value of the market price of their shares.
Managers and shareholders have believed that growth in annual earnings per share and increases in return on equity were the best measures for maximising shareholder wealth.
However, traditional accounting measures are not reliably linked to increasing the value of the company�s shares. This occurs because earnings do not reflect changes in risk and inflation, nor do they take account of the cost of additional capital invested to finance growth.
There are a number of other reasons why earnings fail to measure changes in the economic value of the business. These are:
-
Alternative accounting methods may be employed.
-
Dividend policy is not considered.
-
The time value of money is ignored.
The value of a companies shares will only increase if management can earn a rate of return on new investments which is greater than the rate investors expect to earn by investing in alternative, equally risky companies.
The real secret is that while earnings are just an opinion, cash flow is a fact. As we shall see later, when discounted by the cost of capital, free cash flow gives us an accurate assessment of the economic value of an investment. However, the cash flow approach only provides a valuation, it does not generate a year-by-year performance measurement such as EP.
Since the concept of �maximising shareholder wealth� was developed in the 1970�s, more and more enlightened managers are focusing on strategies which maximise economic returns for shareholders, as measured by dividends plus the increase in the company�s share price.
One way of viewing the �shareholder value� approach is to value the business using EP as a valuation methodology.
EP = (r - c*) x Capital
In other words EP is the dollar amount that the managers of the business have
added to or subtracted from the capital invested in the business for the year
under review.
6.2 Market Value Added (MVA)
The market value added of a business at a point in time is the difference between the enterprise value [market capitalisation (number of shares X by the share price), plus debt]and the capital invested in the company [total of debt (book value) and equity contributed].
Theoretically, market value at a point in time is equal to the total capital employed plus or minus the net present value of all future EP�s. Therefore, market value is maximised by maximising the present value of future EP�s.
Consequently, if we prepare a projection of annual EP�s into the future and discount these projections to the present value, at the cost of capital, we get an estimation of market value that management has added to or subtracted from the total capital employed in the business. This present value of all future EP�s is theoretically equal to market value added, MVA.
Therefore the market value of a business is:
Market Value = MVA + capital employed.
6.3 An Example of an EP Valuation
If we take a hypothetical business, XYZ, which is achieving a steady rate of return, r, on opening capital of 12%. The cost of capital for the business is 10% Management�s targeted policy is to reinvest 75% of NOPAT into the business. NOPAT for last year, 1993, was $1,200.
Assume that the business will continue to grow on this basis for five years until 1998. At this point we assume that the business has reached its time horizon called T. Beyond T the rate of return to be earned on new investments over and above the reinvestment of depreciation, will drop to a level equal to the cost of capital.
The reason why every business has a time horizon T is that eventually competition forces down the rate of return. Even though a business may continue to grow in size beyond T, the prospect of this growth will not add to its current value.
After T has arrived, new capital investment will only earn a return equal to the cost of capital and EP will cease to grow and will continue at this level as a perpetuity.
In practice T varies from 0 - 30 years depending on such factors as:
-
Geographical area
-
Economic and political outlooks
-
Perceptions of management strengths and weaknesses
-
Government regulations
-
Improvement in technologies and development of substitutes
-
The business cycle
-
Differentiation established through scientific, marketing and service skills
-
Perception of value of trademarks and names.
Set out below is the EP valuation of business XYZ based on the above assumptions.
In this example the factor to calculate the present-value of each $1 of EP in perpetuity is 6.512. It is calculated by computing the value of a perpetuity payment of $1.
Perpetuity value =
annual EP
cost of capital
=
$1
= $10
10%
Thus, each $1 of perpetual EP beginning in 1999 is worth $10 as of 1998. The $10 perpetuity value is discounted from 1998 to its present value in 1993. The PV factor for five years is 0.65123. Multiplying this factor by 10, the overall PV factor for the perpetuity is 6.5123, a factor that automatically capitalises each dollar of EP as perpetuity and discounts the resulting perpetual value to net present value.
EP Valuation of Business XYZ
|
|
|
1994 |
1995 |
1996 |
1997 |
1998 |
1999 |
2000 |
|
NOPAT |
(a) |
1,308 |
1,426 |
1,554 |
1,694 |
1,846 |
2,012 |
2,163 |
|
Capital at beginning of year |
(b) |
10,900 |
11,881 |
12,950 |
14,115 |
15,385 |
16,770 |
18,279 |
|
r (a/b x 100) (EcROCE)% |
(c) |
12% |
12% |
12% |
12% |
12% |
12% |
11.83% |
|
C* |
(d) |
10% |
10% |
10% |
10% |
10% |
10% |
10% |
|
Spread (c-d) |
(e) |
2% |
2% |
2% |
2% |
2% |
2% |
1.83% |
|
EP (b x e) |
(f) |
218 |
238 |
259 |
282 |
308 |
335 |
335 |
|
PV factor at 10% |
(g) |
.9535 |
.8668 |
.7880 |
.7164 |
.6512 |
6.5123 |
|
|
PV of EP |
(h) |
208 |
206 |
204 |
202 |
200 |
2182 |
|
|
Cumulative PV |
(i) |
208 |
414 |
618 |
820 |
1020 |
3202 |
|
|
Capital (see note 1) |
(j) |
|
|
|
|
|
11433 |
|
|
Market value (i + j) |
(k) |
|
|
|
|
|
14635 |
|
Note 1: Capital is grossed up for the time value of money by adding six months
interest at the cost of capital - $10900 x (1 + 10%) 0.5.
Note 2:
The calculation has been done for year 2000 to show
that EP no longer increases when the return on new investment equals the cost
of capital
Note 3:
NOPAT grows for 1 year beyond T because it is
assumed that making an investment in one year will only see the return showing
up in the following year
Note 4:
The present value factors which have been used are
the mid year factors and consequently the capital at the beginning of the
first year of the projections has been grossed up for half a year�s interest
earned at the cost of capital.
Note In respect on point 1 above, in practical terms Opening balance calculations are often used since determining average capital makes the concept more complex.
7. Cash Flow
7.1 Overview
The most popular valuation technique used around the world today is discounted cash flow. Before we consider the discounted cash flow valuation methodology, we need to define the cash flow, which is to be discounted.
7.2 Single Bank Account Cash Flow
If a business had a single bank account only, there would be no confusion as to the cash flow calculation.
|
Example |
1998 |
1999 |
|
Bank Overdraft |
$100 |
$250 |
The cash flow would be the difference between the opening and closing bank balance, which is - $150. However, businesses use many different financing vehicles and as a result the calculation of cash flow becomes more complex.
7.3 Accounting Standard Cash Flow
Accounting standards require a statement of cash flows that has the following components:
|
Example |
1998 |
Change |
1999 |
|
Cash on hand |
10 |
2 |
12 |
|
Cash deposits |
50 |
20 |
70 |
|
Readily marketable securities |
30 |
8 |
38 |
|
Net of: |
|
|
|
|
Bank overdraft |
-100 |
-150 |
-250 |
|
Short term total |
-10 |
-120 |
-130 |
|
Short term cash flow |
|
-120 |
|
This calculation of cash flow specifically excludes long term debt, finance leases, commercial bills (amongst others) and is therefore incomplete and can be misleading.
7.4 Net Cash Flow
Net cash flow is defined as the change in net indebtedness of a business, which encompasses all forms of debt financing and cash or near cash equivalents.
Although it is useful to know the short-term cash flow of a business by understanding its liquidity and its ability to pay its way, it is of overriding importance to understand net Cash Flow.
|
Example |
1998 |
Change |
1999 |
|
Cash on hand |
10 |
2 |
12 |
|
Cash deposits |
50 |
20 |
70 |
|
Treasury bills |
15 |
8 |
23 |
|
Investments earning interest |
15 |
0 |
15 |
|
Net of: |
|
|
|
|
Bank overdraft |
-100 |
-150 |
-250 |
|
Current portion of finance leases |
0 |
0 |
0 |
|
Other loans |
-10 |
-11 |
-21 |
|
Other short term loans |
-2 |
-88 |
-90 |
|
Long term debt |
-200 |
-150 |
-350 |
|
Non current finance leases |
-200 |
50 |
-150 |
|
Total |
-422 |
-319 |
-741 |
|
Net cash flow |
|
-319 |
|
From the above example you can see that the Accounting Standards Cash Flow shows the business to be cash flow negative to the extent of 120. However, the Net Cash Flow in this example is negative 319, which shows that, in fact the entity had to increase its borrowings substantially.
Every Cash Flow calculation is decided by its components.
You should be able to reconcile the Accounting Standard Cash Flow to Net Cash Flow taking into account the financing section of the cash flow statement. However, in practice some companies somewhat conveniently exclude certain financing activities from the calculation.
7.5 Operating Cash Flow
Operating cash flow is simply the cash flow generated or absorbed by the internal operations of the business. It is the profit before interest and tax adjusted for the increase or decrease in total net assets, i.e.:
Operating cash flow = EBIT + (opening net assets - closing net assets)
7.6 Free cash flow
Free cash flow is the operating cash flow after tax, which is available to reward all providers of capital. It is the cash flow that is �free� or net of all cash invested for growth in the business.
When building a free cash flow statement:
-
Start with sales as an approximation of cash receipts from operations.
-
Deduct expenses, which represent the operating cash out flows.
-
Deduct the �cash operating taxes�. These can be estimated as follows:
� Take the accounting tax charge in the profit and loss account;
� Remove the deferred tax and future income tax benefit components;
� Add the tax which would have been paid had the interest expense not sheltered some of the operating profits being taxed.
-
Deduct all cash used to grow the assets on the balance sheet. This is cash outlaid for increases in working capital, newly fixed asset beyond the capital maintenance provided by depreciation and any business acquired. All of these outgoings are termed investment, I. Another way of determining I is the period-to-period change in capital employed.
To summarise:
|
Sales - COS and operating expenses - tax = NOPAT
|
|
NOPAT - (increases in working capital + new capital expenditure) = FCF
|
|
OR:
|
|
FCF = NOPAT - I |
It is, of course FCF, which should be used to value a business. If we forecast the free cash flows of a business over the expected life of the business and discount them to a present value at a rate, which reflects the risk of the business, we get the market value of the business.
While we have seen that cash flows can be calculated from financial statements, it is often difficult and time consuming.
8. FCF as a Valuation Methodology
8.1 Overview
The other way of looking at the �shareholder value approach� is by estimating the economic value of a company by discounting the forecasted free cash flows by the cost of capital.
The total economic value of a company is the aggregate of its debt and its equity and this is known as �corporate value�. If we deduct the debt from the �corporate value� we are left with the �shareholder value�.
There are two components of the �corporate value�.
1 The present value of cash flow from operations during the forecast period.
2 The �residual value� which is the present value of the company attributable to the period beyond T, the end of the forecast period.
The residual value often makes up a substantial portion of the total value of a company, but its size depends directly on the assumptions made for the forecast period. Although there are several methods that can be used to estimate the �residual value� the most widely used method is the �perpetuity method�.
The perpetuity method of estimating residual value is based on assumptions that over time, the competitive forces will drive down the returns that a company achieves to the point that they will equal the cost of capital. Therefore, after the forecast period the company will earn, on average, the cost of capital on all new investments.
Using the perpetuity method, the present value of a perpetuity cash flow at the end of a forecast period is calculated by dividing the perpetuity cash flow by the cost of capital, time PV factor.
Residual value =
Perpetuity cash flow
cost of capital
The residual value in the FCF valuation below is thus:
Residual value =
2012 x .65123
.10
= 13103
8.2 An Example of an FCF Valuation
If we apply the discounted FCF approach to the valuation of business XYZ used earlier we get the following:
|
FCF Valuation of Business XYZ |
||||||
|
|
1994 |
1995 |
1996 |
1997 |
1998 |
1999 |
|
NOPAT |
1308 |
1426 |
1554 |
1694 |
1846 |
2012 |
|
I |
981 |
1070 |
1165 |
1271 |
1385 |
0 |
|
FCF |
327 |
356 |
389 |
423 |
461 |
2012 |
|
PV factor @ 10% |
0.9535 |
0.8668 |
0.7880 |
0.7164 |
0.6512 |
6.5123 |
|
PV of FCF |
312 |
309 |
307 |
303 |
301 |
13103 |
|
Cumulative PV |
312 |
621 |
928 |
1231 |
1532 |
14635 |
As we have seen with the EP valuation, beyond T the return earned on any new capital investment is equal to the cost of capital. In this case, because we are discounting at the cost of capital, any such additional investment will not increase the present value. Consequently, for the purposes of the valuation we can assume that there is no further I beyond T. Thus, NOPAT ceases to grow and FCF and NOPAT remain equal in perpetuity.
Again we have used the mid year factor for discounting and we have assumed that NOPAT grows for a year beyond T because it is assumed that the return on an investment only takes place the following year.
It can now be seen that the FCF valuation methodology gives exactly the same answer as the discounting of EP for a given forecast.
8.3 Conclusion: Use EP/MVA to support the DCF valuation
The advantages of the discounted cash flow method are that it:
-
Is based on free cash flow which is therefore more �factual�
-
Does not require value based accounting adjustments in order to be accurate
-
Provides a comprehensive measurement for long term value analysis
-
Intrinsically takes into account the time value of money by discounting at the cost of capital
On the other hand, EP/MVA has the following advantages:
-
By forecasting EP for each year it shows how much value will be added to the capital employed each year
-
It is the only method that can clearly connect capital budgeting and strategic investment decisions with a methodology for subsequent evaluation of actual performance
-
By forecasting annual EPs it automatically produces a series of targets for management to achieve in order to justify the valuation.
-
It can be readily communicated to and understood by operational management
-
Through the computation of annual EPs it creates a meaningful performance measurement, which can be used to judge subsequent performance. (The cash flow performance of one business just cannot be compared with another.)
-
For a project to be favourably considered, EP must be positive for each year of the forecast. On the other hand FCF may fluctuate from positive to negative and back again over the life of the project.
-
EP focuses management�s attention on the fundamental three ways to create value. These are:
� Improve profits without making a further investment in additional capital
� Only invest in projects where earnings exceed the cost of capital
� Dis-invest from projects where the savings on the capital cost exceeds earnings foregone
Discounting the benefits of these strategies in FCF terms makes them difficult to understand
-
EP is a powerful overall measurement of management�s performance. It is an ideal method for setting corporate goals, management incentives and the payment of performance bonuses. This cannot be achieved with cash flow
-
It links planning to performance, and performance to value.
9. Examples of Use of EP for Decisions
9.1 Operational
-
Identification, selection and development of highest value strategy
-
Establishment of realistic targets
-
Identification of requirements to meet targets
-
Identification of which areas of a business to focus on
-
Evaluation of cash generation abilities
-
Budgeting
-
Communication of value concepts to managers and the market
-
Management compensation schemes
-
What if analysis
-
Scenario planning
-
Working capital management
-
Capax planning
-
Selecting the optimal product mix
-
Evaluating the consequence of various decisions
9.2. Strategic Planning
-
Managing a portfolio of businesses
-
Ranking of business units on the basis of performance
-
Determine optimum dividend levels
-
Determining the optimum capital structure
-
Optimising the level of debt and equity
-
Setting expected business performance levels
-
Competitor analysis/benchmarking
-
Investor communication
-
Analysis of financial health
-
Evaluating the effectiveness of client current strategies
9.3 Specialised Use
-
Screening potential acquisitions
-
Determine basis for �success� fees
-
Establishment of the value of divestments
-
Evaluating synergies
-
Restructuring analysis
-
Establishing buy/sell prices
-
Identifying under/overvalued shares
-
Industry analysis and comparison
-
Determining the ability of a business to generate cash flow to payback debt
-
Evaluate the sensitivities in a business to cash flow
-
Measuring the impact of changes to credit terms
-
Evaluating market expectations of cash flow
10. Value Based Management Accounting
10.1 What is the purpose of value based accounting
To do construct value-based accounts, GAAP data needs to be examined in more detail to convert it to economic results, which more correctly reflects correlates to share price performance.
The contents of management accounts must satisfy your managers� requirements to manage effectively. For management accounts to be useful they not only have to represent the past accurately, but also they have to be effective when used as an aid to decision making.
Management accounts should allow their users to determine:
-
How have we gone?
-
Are we on track?
-
If not, why not?
Management should then be able to use this information to decide:
-
What can I do?
-
How do I do it?
What are the benefits? Good decisions that create shareholder value should, in subsequent management reports, be reflected by improved performance.
The economic value of a business is determined by the perception of the size and timing of its future cash flows combined with risks associated in achieving these cash flows.
It is vital to measure past performance using the same cash flow techniques in order to understand how a business has actually performed. The Profit and Loss must therefore measure the cash operating profits generated by a business (as distinct from accounting opinions) and the balance sheet should approximate the actual level of cash invested by all providers of capital.
10.2 Basic principles of value based accounting
The basic principles of value-based accounting are:
-
Treatments decided by cash flow timing
-
Remove as many opinions as possible
-
P & L approximates cash revenues and expenses
-
Balance Sheet approximates actual cash invested
-
Investment in Assets is depreciated against expected future cash flows
-
R & D capitalised and expensed over the lives of successful projects
-
Concentrate on Cash Flows being the FACTS
The most fundamental part of value-based management is to measure as closely as possible the cash returns generated on invested capital. There is a strong correlation between these cash flow returns and the value of an entity. Any �shareholder value� approach that ignores a value based management accounting approach has to be intrinsically flawed.
10.3 Adjustments to GAAP accounts
The number of adjustments made should be kept to a minimum.
The decision �to adjust, or not to adjust� should be based on the materiality of the transaction, coupled with the impact of management decision making. Managers must be provided with quality information that:
-
Allows for good decision making
-
Tells them accurately what is going on
-
Allows comparison of plans against reality
-
Allows for fast reaction
-
Assists them to achieve their goals
Decision criteria are:
-
Cash Flow timing
-
Material in nature
-
Recurring in nature
-
Ability of management reporting system to cope
Traditional accounting formats are still very important for satisfying debt covenants and other financing issues and it is important to distinguish between financing issues and value issues. A well-financed business can destroy value and vice-versa.
The following areas have to be addressed in Value Based Accounting:
-
Revenue in advance
-
Numerous provisions
-
Investment in Intangibles
-
Non-recurring Unusual Gains/Losses
-
Operating Leases
-
Revaluations
-
Depreciation issues
A policy decision should be taken for each issue and each decision must be able to be challenged and successfully justified.
It is important that once a company has adopted Value that assets should not be revalued for Value Based Performance measurement. The prime reasons for not valuing to market are:
-
The subjective nature of any revaluation of non traded assets
-
The potential costs associated with continuous revaluations.
Asset values should still be examined regularly to determine hold/divest strategies and replacement decisions.
11. Value Based Framework
How do you construct value-based accounts?
11.1 Capital
Capital is the lifeblood of any business and is the logical starting point for any financial analysis. A company that struggles with its capital structure places itself in survival mode. It is vital that a sustainable capital structure is in place and that strategic management has a structured approach to capital allocation.
Marketable securities should be netted off interest bearing loans because most businesses do not actively invest in cash. Surplus cash holdings can be used to invest in new assets, pay back debt or be returned to the shareholder by way of dividends. However cash on deposit should not be excluded from the calculation of net operating assets, if surplus cash is kept then a business must earn a return on it.
Certain businesses use shareholders� loans as the most tax effective means of raising finance. These equity loans could be reflected as part of equity.
The tax provision should be treated as a current liability but deferred taxes and FITB should be treated as �Other Capital�. The provision for dividend should be treated as part of �Other Capital� as it is not an operating current liability but really equity that is waiting to be paid out. The capital structure of a business impacts the Cost of Capital value driver.
11.2 Net operating assets
Net Operating Assets should reflect the total assets invested in a business net of any credit provided by suppliers.
The three major groupings found in net operating assets are current assets, current liabilities and fixed assets.
By providing a framework where the operating assets are devoid of financing issues, you are now in a position to communicate the balance sheet to non-financial management and cascade this knowledge down into a company.
The ability to manage only one side of the balance sheet allows operating managers to easily understand the real issues that have to be addressed. Inventory levels have to be optimised, outstanding debtors must pay on time and any capital expenditure must generate an economic return.
11.3 Operating profits
It is important to be able to analyse the underlying operating profits of a business as it is operating issues that largely dictate the value placed on an entity by investors. The manner in which a business is financed is a separable (not severable) issue.
The point at which operating performance has traditionally been analysed is the EBIT level. However, investors are interested in after tax returns and decisions to invest capital are therefore dictated by the after tax return on capital. Governments use taxation incentives to attract investment and these potential benefits have to be recognised.
NOPAT (Net Operating Profit After Tax) takes into account tax at an operating level.
NOPAT is unaffected by financing issues as it deducts any tax shield of interest.
The operating profit and loss takes into account three key value drivers: - revenue growth, operating margin (EBIT%) and the cash tax rate.
To evaluate performance it is critical to break down costs into four key groupings:
-
Variable Cost of Sales
-
Fixed Cost of Sales
-
Variable Expenses
-
Fixed Expenses
Variable costs are defined as those costs that vary in proportion to revenue over the short term (i.e. one year). Fixed costs are defined as those costs, which are not revenue sensitive over the short term.
Obviously, a fixed cost is only �fixed� until management takes a decision to change it and in the long run all costs are variable. However, analysing your cost structures in this manner will allow sensitivity as well as providing you greater accuracy in measuring the marginal impacts of changes during your planning process.
Another benefit of this cost allocation is that you are in a better position to analyse risk, as the higher your fixed cost structure the more risky your business tends to be.
11.4 Financing costs
Interest payments and dividends represent the financing costs of the business.
While marketable securities may be excluded from the operating side of the balance sheet, a consistent approach to interest received needs to be adopted. If cash is included as part of operations then interest income should also be included.
11.5 Retained profits
Retained profits provide the link between the profit and loss and the balance sheet.
Profits should only be retained in a business to pay down debt or to invest in new opportunities that will provide a commensurate return to shareholders.
It would be expected that the value of a business would rise by an amount equivalent to the perceived future performance of the re-invested capital.
However, in a large number of companies, profits are re-invested by management only because they have the cash, not because of the potential of the new investment. This factor often causes management to invest in non-core operations and can become a licence to spend shareholders� funds unwisely.
Value based analysis of past performance often uncovers the fact that companies� retained profits have been spent on investments that do not cover the cost of capital. This often causes a review of how capital is allocated. The level of retained profits has a major influence on the ability of a business to finance its growth.
Retained Profits impact the Affordable Growth Rate by virtue of the retention ratio. The Affordable Growth Rate measures the growth rate a business can sustain while trading at its target debt to capital. Retained profits influence two of the value drivers: Cost of Capital (WACC) and Growth duration.
11.6 Operating performance
The operating profits divided by the Net Operating Assets measure return on investment. This integration of the profit and loss and balance sheet forms the basis for performance measurement.
By using Net Operating Profit After Tax (NOPAT) you are able to measure Economic Return on Capital Employed (Ec ROCE). This provides an excellent indication of operating performance as it takes into account the following five value drivers:
-
Revenue Growth
-
Operating Margin (PBIT%)
-
Cash Taxes
-
Working Capital Investment
-
Fixed Asset Investment
However, we are still not in a position to determine if X% is a good return.
11.7 Financing
The Cost of Capital provides the benchmark for determining good or bad performance.
Most managers are aware that debt has a cost (interest payments) but few are aware of the Cost of Equity. The Weighted Average Cost of Capital (WACC) factors in the cost of both debt and equity.Operating managers often hold the belief that capital is scarce but free. Using WACC as a benchmark should allow them to view it as plentiful but expensive.
Equity is more expensive than debt due primarily to shareholders being exposed to greater risk and the fact that equity is not as tax effective as debt financing.The use of a cost of capital allows you to measure performance on a risk-adjusted basis.
The spread between the Return on Capital (Ec ROCE) and the Cost of Capital (WACC) allows you to determine whether or not value is being created.It is only once a business earns profits in excess of the cost of capital that it starts to create value for its shareholders.
Value will not necessarily be maximised by maximising the spread.
However, the spread can now be used to calculate the level of economic profits. This is because value increases provided that all new investment exceeds the cost of capital. In certain cases value may be created despite the fact that the spread is declining.
11.8 Operating and financing
The spread multiplied by Capital gives rise to the economic profit measurement known as EP (Economic Profits). EP can be calculated by using the spread method as above or the capital charge method, which calculates EP as:
EP = NOPAT - Capital charge, where Capital charge = Cost of capital x capital employed.
11.9. EP - Economic Profits
The spread method gives you greater information whilst the capital charge method is simpler to communicate.
Economic Profits (EP) takes into account all six-value drivers that impact performance. By maximising EP on a sustainable basis you take into account the final value driver (growth duration) and are in a position to manage within the complete value framework. The present value of future EPs equals Market Value Added (MVA).
11.10. MVA Market Value Added
MVA is the spread between the capital invested in a business and its market value. It is the most important measure of value and should be maximised. The only way to maximise MVA is to maximise EP on a sustainable basis. As an EP/MVA valuation gives you the same answer as a Cash Flow Valuation you are able to integrate performance (EP) and value (MVA).
12. Converting financial statements
What adjustments are necessary to convert GAAP accounts to value based. The answer is that there are many adjustments, which would vary from company to company. There are over 100 possible adjustments; but in practice 5-10 would be made in any one company.
A number of most common examples follow. Most adjustment will require both NOPAT and the Balance sheet to be adjusted.
The following shows the general format of how the adjustments are made on accounting statements.
Profit and Loss.
Operating profit(loss) after tax |
|
|
add back net interest |
|
|
add back tax |
|
|
|
|
|
Accounting EBIT per Annual Accounts |
|
|
|
|
|
Add/(deduct) unusal gains & losses |
|
|
Non recurring gains (losses) |
|
|
Abnormal Items |
|
|
Normalised EBIT |
|
|
|
|
|
Equity Equivalent Adjustments |
|
|
Changes in provisions (Doubtful debts, Inventory) |
|
|
Reverse Goodwill amortization |
|
|
Reverse Interest on Operating leases |
|
|
Reverse Revenue in Advance |
|
|
Total Equity Equivalents |
|
|
Adjusted EBIT (Value Based) |
|
|
Less Cash Taxes |
|
|
= NOPAT |
|
|
|
|
Balance Sheet.
The Balance Sheet is adjusted to (a) separate operations from Finance (reclassification), and (b) include economic equivalents. These may go back for say 5 years and therefore are the cumulative adjustments, restating the capital of the company.
|
Net Assets per accounts |
|
|
|
|
Adjusted for |
|
|
Add back all interest bearing debt |
|
|
Reverse FITB/deferred taxes |
|
|
Add the PV operating leases |
|
|
Reverse Asset Revaluations |
|
|
Reverse Goodwill amortised |
|
|
Add the Cumulative Abnormals after tax |
|
|
Reverse specific Provisions (e.g. Inventory) Other Equity adjustments (provision for dividend, construction in progress) |
|
|
=Adjusted Capital Employed |
|
|
|
|
|
|
|
Specific comments of some of the possible adjustment follow.
12.1 Revenue in advance
Certain businesses receive payments from customers before accounting standards allow them to recognise this revenue in the Profit and Loss. Examples of this include subscriptions, membership fees, premiums and progress payments.
It can be advantageous to performance monitoring and decision making to recognise such revenue as and when it is received. This treatment can have a huge impact on the way management see their performance and extreme care should be taken in deciding on this particular adjustment.
12.2 Provisions
It is common practice for accounting standards to dictate opinions as to payments or write offs that may occur in the future based on the past. Unfortunately, these provisions tend to become permanent fixtures on the balance sheet and grow as the business grows. Their effect can be to understate both the economic profits and the invested capital of a business. Such actions distort the principles of cash flow timing and certainty. It is prudent to reverse these provisions and so more accurately calculate the true cash costs of these expenses.
Material, recurring provisions that tend to grow as the business grows should be reversed.
The following provisions are often reversed:
-
Provision for doubtful debts
-
Provision for inventory diminution
-
Provision for employee entitlements
-
Provision for warranty claims
-
Sundry provisions
12.3 Research and development costs (& other intangible investments)
Traditionally research and development is expensed in the year in which it occurs even though the cash flow receipts from such investment are expected to eventuate in future years. Analysis of companies, which committed significant amounts to research and development, has shown that the stock market views such expenditure positively (provided that the market believes that future cash returns will eventuate).
Value based accounting requires consideration as to whether all research and development (both successful and unsuccessful) should be capitalised and written off over the life of successful product research and development. Exploration costs should be treated in the same manner as outlined above.
12.4 Unusual non-recurring gains/losses
Value based principles measure operating performance on the basis of the recurring cash earnings that a business can generate from its ongoing activities. All abnormal, extraordinary and other non-recurring losses/(gains) should be added to/(deducted from) capital on an after tax basis. This adjustment satisfies full cost accounting practice as opposed to successful efforts.
12.5 Goodwill
Goodwill is defined as the premium paid for a business entity above the book value of its assets. As the life of a business is regarded as indefinite, goodwill amortisation is reversed from the Profit and Loss and added back to Capital. This ensures that you measure the cash return on acquisitions against your cash investment in these businesses.
12.6 Operating leases
Operating leases represent a form of financing and should therefore be treated accordingly in order to implicitly separate operating performance from financing activities. In this context an operating lease is defined as any non-cancellable lease. Examples include trucking or vehicle fleets as well as office, retail or factory space rentals. The discounted leases should be treated as debt and asset equivalents.
All operating leases should be present-valued at a flat interest rate (eg your secured borrowing rate) and this present value is added to capital. Operating leases beyond 5 years can be present valued as if they occurred in 7.5 years.
An implied interest portion calculated at the flat interest rate on the average present value of leases outstanding is deducted from operating lease expenditure and added to net interest paid. The remainder of the rental expense is assumed to be depreciation expense associated with the asset.
This treatment helps remove any �Rent or Buy� bias from the analysis as well as providing a greater understanding of a company�s outstanding liabilities.
An operating lease becomes, in effect, a financing lease and is treated in a similar manner.
12.7 Provisions for deferred tax (and future tax benefits)
The Taxation charge in the Profit and Loss is not a true reflection in many cases of the actual cash tax paid by a business because it can include a provision for deferred tax. The deferred tax provision is caused by the tax effect of timing differences on tax payable between the period they are recognised for accounting purposes and the period they are assessable for income tax purposes.
One of the major components of this provision tends to be caused by variances between useful life depreciation and taxation depreciation on fixed assets. In the normal course of business life, these assets will have to be replaced giving rise to further timing differences and so the deferred tax provision tends to become permanent equity that increases with business activity.
Future tax benefits are netted off the provision for deferred tax. The net increase/(decrease) in deferred tax provision is deducted from/(added to) the taxation charge in the Profit and Loss, and added to equity.
12.8 Revaluation reserves
Asset revaluations have no impact on cash flow. In order to approximate actual cash costs of assets, the asset revaluation is reversed and therefore deducted from capital. However, it is possible to choose a �starting point� for value management, which would include previous revaluation reserves. This would allow a �fair� starting point. However, once a business is measured on a value basis you should not allow revaluations in your performance monitoring.
Obviously, revaluations should be performed in order to improve debt covenants and other financing issues as well as to decide on �hold or divest� strategies. This example vividly illustrates the conflict between performance monitoring, valuation issues and statutory issues. You cannot have a single format of accounts that satisfies all these requirements. Management accounts must allow you to measure performance accurately.
12.9 Foreign exchange fluctuations reserve
This reserve occurs due to changes in the value of foreign held assets and liabilities caused by currency fluctuations. There is no impact on cash flow until the assets are realised. This reserve is reversed and deducted from capital.
12.10 Depreciation
EP is measured after subtracting depreciation from the income statement and the balance sheet. The reason is that depreciation is a non-cash economic charge. Depreciation suffered by assets through wear-and-tear and obsolescence must be recovered from a company�s cash flow over time in order to provide investors with a return of their capital before they can enjoy a return on their capital.
In the alternative, consider a leased asset. The lessor would charge the lessee for a recovery of the asset�s cost through the lease payment. In fact, the present value of the lease payments (ignoring tax shields for simplicity) should equate to the cash outlay to purchase the asset, or else the lessor would not be able to recover the principal outlay and the interest incurred in purchasing and financing the asset on behalf of the lessee. Depreciation is thus an economic charge, because it is a cash equivalent charge (in the sense you would pay for depreciation in cash if you leased the asset instead of owning it).
Said differently, if depreciation was not a charge, why would anyone ever lease an asset when by owning it the cost of depreciation could be avoided?
Therefore, Depreciation/Amortisation of limited life assets is the only allowable book entry in Value Based Accounting. Assets such as plant and equipment wear out and have to be replaced. This means that the cash flows generated by these assets will also have a finite life. These assets should be depreciated over the period that they are expected to generate cash returns. Certain long life assets must be regarded as having indefinite lives. This is particularly relevant in government trading organisations where they have infrastructure assets such as land, dams, water pipes or electricity pylons with uncertain lives. In these cases, it could be wiser not to depreciate these assets in management accounts.
13. EP and Capital Project Evaluation
The EP valuation method can be used to evaluate individual capital projects as well as to evaluate whole companies. Because EP is a residual income measure that subtracts the cost of capital from operating profits, discounting EP produces the same net present value answer as discounting projected cash flows and subtracting the upfront investment.
Consider a simple project in which $2,000 of capital is invested in two equal stages, $1,000 up front and $1,000 at the end of the first year. The project rings up $250 of NOPAT in the first year and $500 thereafter. Once the project reaches steady state in the second year, the only investment made is depreciation, which is subtracted from NOPAT. Discounting operating cash flow (at a cost of capital of 10%) and capitalising terminal FCF as a perpetuity yields a net present value of $2,863.
That represents the value created after the investment is recovered (hence the word �net� in net present value). The project appears to be a winner.
|
FCF Approach |
0 |
1 |
2 |
|
NOPAT |
$ 0 |
$ 250 |
$ 500 |
|
- l |
1,000 |
1,000 |
0 |
|
FCF |
$-1,000 |
$- 750 |
$ 500 |
|
x PV factor at 10% |
1.0 |
. 9091 |
9.091 |
|
Net present value, $2,863 |
|
|
|
An alternative approach is to compute the project�s EP year by year and discount it to a present value in the following table, capital accumulates as the investments are made. EP is computed by subtracting a 10% charge for the use of capital outstanding at the beginning of the year against each year�s anticipated NOPAT. The present value of EP is just the net present value of the capital project, $2,863.
|
EP Approach |
0 |
1 |
2 |
|
NOPAT |
0 |
$250 |
$500 |
|
Capital |
$1,000 |
$1,000 |
$2,000 |
|
Beg capital |
0 |
1,000 |
2,000 |
|
x c* |
10% |
10% |
10% |
|
Capital charge |
$0 |
$100 |
$200 |
|
EP |
$0 |
$150 |
$300 |
|
x PV factor |
1.0 |
.9091 |
9.091 |
|
Net present value, $2,863 |
|
|
|
Thus, the classic capital budgeting rule to accept all positive NPV projects can be restated: Accept all projects that have positive discounted EPs. It is one and the same thing.
But by stating the project acceptance criteria in EP terms, rather than in terms of discounted cash flow, operating and planning people can clearly connect the way in which individual projects are evaluated and the manner in which subsequent performance will be evaluated.
14. Implementation of EP in a Company.
The following provides an overview of the methodology for implementing EP as a management and measurement tool.
- Establish Senior Management Commitment. Management must understand and support the concept from the top. Top management commitment will drive the implementation process.
- Divide the Organisation into Profit Centres or Business Units that resemble Independent Companies. The objective is to identify the operating units to hold accountable for creating economic value. If a company is diversified with several different lines of business, the performance of each division or business unit must be assessed separately to reflect differences in business risk and debt financing capacity. For example, requiring all operating units to cover a single cost of capital may unfairly penalise low risk businesses and inadvertently subsidise high-risk ones. This process usually requires that the last 4 years of the Companies management accounts be evaluated to establish the EP�s of each business unit.
- Assign the Capital Used to Each Business. This includes assets found on the balance sheet such as working capital and fixed assets. It also includes period costs that are intended to generate returns in the future such as R&D, education and training, etc.
- Calculate After-Tax Operating Profit Generated by each Business Unit. This calculation is the normalised measure of operating results. For example, if significant it excludes the effects of changes in reserves, goodwill amortisation, nonrecurring charges and credits, and earnings from non-operating activities (such as temporary investments of surplus cash). It also includes the effects of capitalising R&D, recognising true depreciation and properly accounting for exchange gains and losses.
- Determine the True Cost of Capital Used in Each Business Unit. That cost is the blended cost of debt and equity capital. It is calculated by weighting the individual costs of debt and equity by the relative proportion each represents in the company's target financial structure.
- Calculate Economic Profits (EP).
- Incorporate EP into the Company's Reporting, Capital Budgeting and Planning Processes. The goal is to define EP in a practical manner that balances simplicity and precision. Internal financial information can provide a common point of reference for short-term and long-term performance goals. This often involves incorporating the business unit current business plans and using EP to test these plans and future plans which form part of the Market analysis and evaluation of alternate operational models.
- Use EP to Focus Performance Incentives and Bonuses. Since EP measures value creation and can be figured at levels well down in the business, it is an ideal framework for managers' compensation. The traditional budgetary process provides managers incentives to aim low in negotiating a target that's easy to beat. This would involve ensuring that management understand the business drivers for improving EP. Goal seeking and sensitivity analysis would be performed.
- Educate Managers in EP Concepts. Show them how maximising EP is linked to strategic goals and specific value drivers, how the value drivers translate into detailed business objectives at the process level, and how all of this can be applied to operating decisions by aligning individual employee objectives with the business strategy. The idea is to take an overall objective--maximise economic value--and break it down into tangible things that can be measured at the lowest level in the business. The challenge is in introducing and communicating the methods so that general managers, product managers, engineers, sales managers, and other decision makers can use them to focus their decisions on adding value and executing strategy.
- Educate Operating People - Train operating decision makers in the use of EP.
- Communicate with Shareholder. Inform the investment community about the changes in financial management practices and incentives the EP process has brought about. Tactics can include a separate EP section within the annual report and meetings with institutional investors.
- Take Actions to Increase EP. Use EP to evaluate and focus resource allocation decisions, identify marginally profitable businesses, and increase focus on core competencies. Using it can focus management on strategic resource allocations that can create wealth for the owners of the business. There are four ways to increase EP:
-
Earn More Profit Without Using More Capital. Cost reduction is a step that many companies use to accomplish this; however, there are other ways.
-
Use Less Capital. Re-engineer operations to reduce capital requirements.
-
Lower cost of capital - Refinancing higher coupon debt with lower coupon debt, lower cost foreign financing, and government incentives are examples of ways to reduce cost of capital.
-
Invest capital in higher-return projects - Use the weighted average cost of capital as the hurdle rate when evaluating current and new investments.
- Use EP to Facilitate Cross-Functional Focus on Developing Core Competencies. This practice avoids unilateral action by one function of the business that leads to suboptimal results overall.
- Use EP to Benchmark Company Performance. EP can be used to benchmark ongoing business performance internally and externally. By evaluating the EP of competitors, management can assess the factors differentiating value between the company and its competition. Internal benchmarking can also result in identifying and executing strategies that maximise EP.