In parallel, institutional investors have progressively become more dominant influences in the board room, not only in terms of the scale of their shareholdings, but also in terms of their increased willingness to apply pressure to have management removed when they deem performance to be unsatisfactory. Little wonder then that increasing numbers of companies have decided to espouse the shareholder value mantra, with many implementing an explicit approach to shareholder value creation, commonly known as value-based management (VBM).
The principle of VBM is that the primary aim of a company, its strategy, its day to day operations, its systems, its processes, its performance measures and incentive systems all have the wealth of shareholders as their underlying guiding beacon, and are aligned accordingly.
The term 'shareholder value' refers to the financial worth of shareholders' investment in a company. There are two main perspectives for assessing the value of shareholders' investment, one is stock market based and the other is economics based. In the long term, both the stock market based and economics based valuations should correspond assuming stock markets function efficiently.
The stock market perspective
The stock market based measure of shareholder value is
simply the company's market capitalisation i.e. the
number of shares in issue multiplied by the share price.
Changes in a company's share price affect the value of
shareholders' investment in the company, and thus affect
shareholder value. If over the course of a year, a
company's market capitalisation were to increase from
say $400m to $500m, then $100m of shareholder value will
have been added.
The economics perspective
According to economic theory, the 'true' or economic
value of a company, sometimes called its business value,
is the net present value of the company's future free
cash flows discounted by its weighted average
opportunity cost of capital (WACC).
The value of the company which is attributable to shareholders, also called shareholder value, is then simply the business value minus the company's financial debt i.e. bank loans & corporate bonds etc. Thus, the economic value of shareholders' investment depends on the company's future free cash flows, the cost of using shareholders' & lenders' capital (WACC) and the amount of financial debt.
Free cash flow - A company's cash flow is made up of three main constituents
- The cash flow from its operating activities
- The cash flow from its investing activities
- The cash flow from its financing activities
Free cash flow is the company's post tax cash flow before its financing activities. It is the sum of the cash flows from its operating activities (operating profit before interest, depreciation & amortization of goodwill less tax) and its investing activities (capital expenditure, change in working capital & any other investments such as shareholdings in other companies).
Free cash flow is the residual cash available (i.e. 'free') to the providers of finance to fund interest payments to lenders, dividend payments to shareholders, repayments of loans, buy backs of the company's own shares and additions to the company's cash/near cash reserves.
If trading conditions are difficult, or if investing activities are particularly heavy, free cash flow can be negative, in which case a company will either have to raise additional capital from its shareholders or lenders, or reduce its cash/near cash reserves. For many companies, free cash flow is a volatile measure.
Opportunity cost of capital - When investors entrust their money to a company, they expect to receive a return by way of compensation. For lenders, compensation is in the form of interest and for shareholders, compensation is in the form of dividends & share price appreciation. The minimum rate of return required by investors is called the 'opportunity cost of capital' and this represents the rate of return foregone by not investing in an alternative investment with the same level of risk.
When investors choose to invest in government bonds of major economies, they are almost certain to receive exactly the level of return expected, and such investments are deemed to be effectively 'risk-free'. The rate of return on government 10-year bonds is around 5% and is effectively a guaranteed 'risk-free' return.
When a bank lends to a company, the company will be required to pay a premium over and above the risk-free rate to compensate for the risk of default on the loan, and the greater the perceived risk of default, the higher the interest rate the bank will require. The rate of interest charged is called the 'opportunity cost of debt'. Because interest is an expense that can be offset against a company's taxation liability, the real cost of debt finance to a company is the net of tax cost (i.e. the rate of interest less the rate of corporation tax, currently 30%).
When investors choose to invest in company shares, they will normally require an even greater return than lenders. This is because, lenders have first call on a company's residual cash flow, whilst shareholders have no guarantee of dividend payments and indeed, should the share price fall, a shareholder's return could potentially be negative. Shareholders will thus require a higher return to compensate for the greater risk they bear and historically, the 'risk-premium' over & above the government bond risk-free rate of return has fluctuated between 5-8%. The minimum return required by shareholders is called the 'opportunity cost of equity' and will vary with the perceived risk associated with the share holding. For example, a venture capitalist investing in a 'high risk' biotechnology start up will expect a significantly higher return than a pension fund investing in a mature 'low risk' utility.
Weighted average opportunity cost of capital - The weighted average opportunity cost of capital (WACC) for a company depends on four factors:
- its opportunity cost of debt finance - assume 5% net of tax
- its opportunity cost of equity finance - assume 15%
- the debt share of total finance - assume 50%
- the equity share of total finance - assume 50%
In this instance, the company's WACC is 10.0% and is calculated as follows:
|
Share of Total Finance |
Opportunity Cost |
WACC |
|
| Debt |
50% |
5% |
2.5% |
| Equity |
50% |
15% |
7.5% |
|
|
|
10.0% |
Net present value - Because investors require compensation for forgoing cash today in expectation of more cash tomorrow, a company's future free cash flows have to be discounted by its WACC in order to convert them into today's equivalent. For example, if a company's WACC is 10%, $100 at the end of the year is only worth $91 today ($100/1.10) and $100 at the year of the following year is only worth $83 today ($100/1.102) and so on.
When all the future discounted free cash flows have been added together the total is what is called 'net present value' of a company. The net present value of a company is the value of its future expected free cash flows in today's money after having accounted for its shareholders & lenders minimum compensation requirements.
The link between the stock market & the economics
perspectives
When the stock markets place a value on a company's
shares, they are factoring into the price all the
publicly available information on the company in order
to make an estimate of the company's net present value
by discounting its future expected free cash flows by
the WACC. However, at any point in time, the prevailing
share price may be above or below the company's 'true'
economic valuation. This is because there are many
factors which combine to affect the day to day price of
a company's shares including unsubstantiated rumours
about either the company or its competitors, momentum
investing or panic selling behaviour, etc. Nevertheless,
in the long run, it does appear that 'truth does get
out' and that stock markets by & large function
efficiently with share prices being anchored, albeit
elastically, to some underlying notion of the 'true'
economic worth of shareholders' interests.
If stock markets estimate a company's future expected free cash flows when discounted by the WACC to be worth $1000m, the net present value of the company, or its business/economic value, is $1000m. Assuming the company was financed by $500m of debt, the value of the company attributable to shareholders, i.e. its shareholder value, would be $500m (business value of $1000m less the $500m debt).
The market capitalization of the company's shares would also be $500m and assuming the company had 100m shares in issue, the current price of the company's shares would $5.00 ($500m/100m).
Should stock markets revise upwards their estimate of the company's economic value, then the market price of the company shares would also move upwards increasing both the company's market capitalization and the value of shareholders' investment in the company, i.e. the shareholder value.
There are three main reasons for this.
Firstly, traditional performance measures rely on the application of subjective accounting rules that present numerous opportunities for management to manipulate results.
Secondly, and more significantly, traditional accounting measures ignore the opportunity cost of capital. No allowance is made for either the amount of capital employed in the company, or the minimum rate of return investors expect to receive from their investment.
Thirdly, because value creation is dependant on future discounted free cash flows, the current amount of operating profit, earnings or earnings per share reported in any one year will often be a poor ruler with which to measure the long term value of shareholders' interests in the company.
In response to these concerns, a plethora of new value-based measures have emerged which advocates claim provide a much more reliable basis for judging value creation performance than the traditional accounting measures. These new measures vary from the comparatively simple to highly technical & complex and include such alphabetical delights as total shareholder returns (TSR), total business returns (TBR), cash flow return on investment (CFROI), economic profit (EP), economic value added (EVA), market value added (MVA), cash value added (CVA), and so on.
The most commonly used new measures are TSR, EP and its close relative, EVA.
Total shareholder returns (TSR)
The total return a shareholder receives is made up of
two constituents, dividends (income) and changes in the
company's share price (capital gains). TSR is measured
by adding the value of any dividends received per share
to the increase in the share price over the period of
measurement, and dividing by the initial share price.
If the resulting percentage is greater than the opportunity cost of equity, i.e. shareholders' minimum expected return, shareholder value is said to have been created. If TSR equates to the minimum expected return, value is said to have been maintained. And if TSR is less than the minimum expected return, value is said to have been destroyed.
TSR can be measured over any time period and it is normally assumed that dividends are reinvested to purchase more of the company's shares. The TSR performance of an individual company may be affected by both short term and industry sector influences on share prices. Therefore, it is normal for a company to compare its TSR performance with that of a peer group of similar companies usually over 3-5 year rolling period.
For most companies, the change in the share price will usually be a much more significant factor than dividends in determining TSR. This is because in recent years, the average dividend yield (dividend per share divided by the share price) of listed companies has been less than 5% and all of the extra return necessary to deliver the opportunity cost of equity, has to come from share price appreciation.
Estimating the current opportunity cost of equity is not easy, not least because opinions on the forward market risk premium is divided. Nevertheless, with a current risk-free 10-year Government bond rate of 5%, the opportunity cost of equity for the average listed company is probably in the range of 9-12%. If we assume for convenience that the current opportunity cost of equity is 10%, and that the average company were to maintain a 2% dividend yield, the required increase in the share price to deliver cost of equity would be 8%. And because shareholders will expect to receive at least cost of equity each and every year, the share price of the average company will have to increase to ever increasing heights by 8% each year merely to meet shareholders' minimum expectations. This means doubling the share price every 10 years. Anything less and value will be destroyed. Value creation is a tough master to serve.
Economic profit
When looking at the value creating performance of a
publicly quoted company, the availability of share price
and dividend data means that calculating TSR is
relatively straightforward. However, when measuring
value creation performance of a private company, or at a
more detailed level within a public company, for example
at the level of a subsidiary or individual business unit
within a subsidiary, TSR is of little practical
assistance. To help overcome this problem, many
companies have adopted an economic profit measure for
internal use.
The technical details & names of these measures all slightly vary from company to company, nevertheless their great beauty is that they all produce a single number, which captures elements from both the profit & loss account and the balance sheet.
Economic profit measures the surplus earned by a business after the deduction of all its operating costs including its liability to pay tax and the opportunity cost of the using its investors' capital employed in the company. At its simplest, economic profit is calculated as follows:
| Operating profit before tax | $300m |
| Tax liability ($300m x 30% tax rate) | ($90m) |
| Charge on capital employed* | ($100m) |
| Economic profit | $110m |
* Capital employed x WACC in this example $1000 x 10%
A more complex version of economic profit is EVA, Stern Stewart & Co's trademarked measure, which involves selecting from up to 164 accounting adjustments to operating profit and capital employed. The term EVA is commonly used within companies even though few bother to make all the adjustments advocated by Stern Stewart.
Measures of economic profit provide powerful insights. Some business units and activities which previously have been thought to be good performers generating healthy accounting profits are very often shown to be 'economically unprofitable' once the costs of tax and capital employed are taken into account.
Nevertheless, reading too much into a single year's economic profit performance can be deeply misleading. As with the traditional accounting measures, economic profit is a single period measure, which is could be susceptible to manipulation by management. For example, a positive economic profit may have been achieved by cutting back on R&D, training and marketing expenditure, all of which are likely to adversely impact upon the long term value of the business by diminishing future discounted free cash flows. Likewise, a negative economic profit may be the result of significant previous capital investment, which although long term value creative, will have an adverse effect on near term economic profitability.
Should a company wish to exceed its shareholders' minimum expectations, thereby creating shareholder value, the company has to produce a continuous stream of new value creating surprises, which have not yet been factored into the company's share price. When a new value creating surprise becomes known to the markets, whether it be an unexpected improvement in the company's underlying economic performance, or the announcement of a new investment decision, the anticipated improvement in the long term economic value of the business will be immediately factored into the share price, causing the share price to increase. From that point onwards, for the company merely to maintain value by producing a TSR that equates to the opportunity cost of equity, the company has to deliver performance in line with the market's revised higher expectations, no matter how difficult this is to achieve. Value creation is a tough master to serve, and one that makes no allowance for previous good performance.
But whilst value creation is a tough master to serve, it is also a fair master to serve. This is because value creation is about future economic performance rather than current or past economic performance. The value creation challenge is as equally 'difficult' to deliver for the 'star' overachiever as it is for the 'dog' underperformer, and likewise also for those companies/business units currently producing a positive economic profit, as it is for those companies/business units currently producing a negative economic profit. Value creation affords all companies a level playing field.
Value drivers
For companies� intent on managing for value, it is
important to have a thorough understanding of what
really drives value in the company. The main factors
that affect a company's future discounted free cash
flows/net present value are termed 'value drivers' and
will vary from company to company, and from business
unit to business unit within a company. Nevertheless,
there are three sets of generic value drivers, which
apply to almost every company & every business unit.
These are the financial drivers, the strategic drivers
and the organizational drivers.
Financial drivers
The four main financial drivers are sales growth, new
investments, return on capital employed (ROCE) and WACC
Growth is a powerful driver of value creation and it is difficult for companies to create shareholder value (i.e. exceed minimum expectations) without growth. However, not all growth is necessarily good, as growth can either be value creative or value destructive.
There are two main ways by which a company can grow; firstly by utilising its existing assets & capital employed to generate more sales & profit, and secondly by new investment. The first type of growth usually improves the 'efficiency' by which capital employed is converted into operating profit & free cash flow and is usually value creative. For the second type of growth to be value creative, the return on investment must exceed the WACC. If the return achieved is less than the WACC, value will have been destroyed. Growth by new investment embodies everything from new capital equipment to acquisitions to marketing expenditure to R&D expenditure, etc.
Not all investments have to be focused on growth in order for them to be value creative. For an investment to be value creative, all that is required is that the return exceeds the WACC. This applies to all investments of cash whether they are for growth, efficiency, site closures, operating cost & headcount reductions, increases in the size of the field sales force, or whatever. Unlike the tyranny of conventional accounting, value creation does not discriminate between cash that is spent on capital expenditure and cash that is spent on revenue expenditure. Cash is simply cash, and companies are charged with investing cash to deliver a return that at least equals the WACC.
ROCE is a measure of the 'efficiency' by which a company converts its capital employed into profit. Improvements in ROCE will almost always create value and can be derived by either improving the net operating margin (gross margin less overheads less tax) and/or improving the asset utilization (the value of sales generated per � of capital employed).
There are numerous individual actions that can contribute to an improvement in ROCE and include increasing prices, improving the sales mix, reducing operating & overhead costs as a % of sales turnover, reducing working capital as a % of sales turnover (stocks & work in progress plus trade debtors less trade creditors), and improving the fixed asset utilization through sales growth.
Although the WACC is a complex & technical issue, it is an important factor in determining value creation, as it is both the denominator for discounting future free cash flows and the minimum hurdle rate that new investment opportunities have to clear. Reductions in the WACC improve both a company's economic value and its shareholder value. Reductions in the WACC also make previously unattractive investment opportunities viable through lowering the height of the hurdle that has to be cleared in order for the investment to proceed. It is, however, difficult for a company to manage its WACC. This is because both opportunity cost of debt and the opportunity cost of equity are at the mercy of the capital markets.
Many companies pursuing value creation have put considerable effort into downsizing and structural cost reductions as the quick fix route to improving near term value creation performance. This contrasts with the findings of a Boston Consulting Group study of major US & European companies during the mid 1990's, which concluded that growth is a more powerful creator of value than restructuring, and that the gains to be made from new investments far exceeded those to be had from trying to squeeze extra juice & efficiency out of old investments.
Strategic drivers
The four main strategic drivers of value creation are
market attractiveness, competitive position, strategy
and innovation.
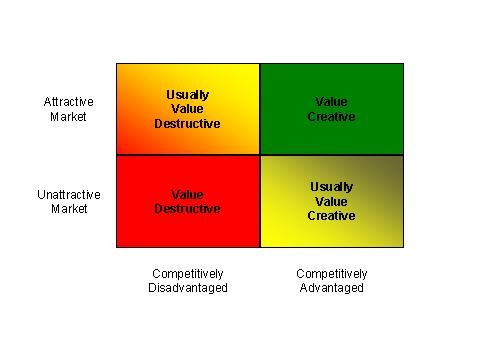
Market attractiveness and a company's relative
competitive position in the market are two complementary
factors, which fundamentally affect a company's ability
to create value. In terms of value creation, an
attractive market is defined as one in which the average
competitor expects to earn a return in excess of the
WACC. The relative competitive position of a business
within a market is determined by the extent to which the
company has the ability to earn returns that are higher
than those earned by the average competitor in the
market. Competitive position is usually a function of
order of entry into a market and relative size, with
disproportionate benefits accruing to first movers and
market leaders. Competitive position is also normally a
more important factor for value creation than market
attractiveness.
Important as market attractiveness and competitive
position are, neither of these are substitutes for
'good' strategy. Value creation is a level playing field
and all companies have equal chances to create value in
the eyes of the value creation master irrespective of
their current start points.
Determining how best to deploy a company's scare resources in order to outmanoeuvre the competition, how to segment a market in order to identify the value creating seams of gold, whether to invest for growth or manage for cash, whether to enter new markets or to exit, whether to acquire or to dispose, are some of the most important strategic decisions which affect a company's value creation performance. Analysis has a key role to play in helping to shape strategy, but it can only help so far. This is because ultimately strategy is about insights and the skill of taking decisions based on predictions about the future value creating alternatives.
The final strategic driver is innovation. The term 'innovation' is widely used within companies and covers a multitude of sins from minor improvements to existing products & services through to major paradigm shifting new initiatives. The common denominator is that almost every company claims to want more innovation, better innovation & faster innovation. This is because innovation can be a powerful creator of growth and value. Unfortunately, over 90% of innovations fail to stick and an even greater percentage result in value destruction. Nevertheless, the disproportionate rewards that accrue from the one 'big success' keep companies chained to the innovation stove.
Organisational drivers
Companies are increasingly coming to recognize that
value creation is not just about the numbers and the
machine-like mechanics of the financial drivers. What
really drives value are the strategic drivers and the
'softer' organisational drivers of which the four main
ones are organisational design, people, processes and
capabilities.
Many companies that have chosen to devote their efforts to the well being of their shareholders have found that putting value creation into practice is a much more complicated task than they had initially envisaged. Managing for value requires fundamental changes to a company's culture and involves a greater deal of time, patience, money and effort. And therein lies the root cause of most company's mediocre success with value-based management programmes.
To create value long term, companies have to be good at strategy, good at the implementation of strategy (Fortune magazine estimates 90% of strategies fail due to poor implementation), good at innovation, good at day to day operations, good at financial management and most importantly, good at the process of management. It is true that value is created & destroyed by a comparatively small number of top level strategic decisions, but it is also true that value is created & destroyed by hundreds & thousands of everyday operational decisions taken at all levels within companies.
All that matters is future performance. And in this regard, value creation is fair master. All companies, irrespective of their past or current economic performance, face an equally difficult challenge to create value. The value creation challenge is about delivering performance that exceeds the markets' expectations and improving a company's future discounted free cash flows. Creating value long term requires companies to identify and implement a continual stream of new value creating surprises, which enhance underlying economic performance. This means focusing on the company's most important value drivers and managing them with proficiency year after year after year. Value creation is a tough challenge.