Why does a company’s share price fall when a company announces that it has missed its cash-earnings targets by a small amount?
Simplistically one can express a company’s value as the net present value of all future cash flow. (This is the equivalent to the sum of capital plus the present value of all future Economic profits (EP) (or EVA a term used by Stern Stewart). While present value concepts are more easily and therefore more commonly applied to fixed income valuation (e.g., the value of bonds) the same concept also holds for shares albeit with much less certainty in the forward numbers.
Therefore, a business generating $100 per year, every year, can be valued into perpetuity as $1000, assuming a 10% cost of capital, or time value of money ($100 divided by 10% = $1000). This base, or zero-growth, case implies a “multiplier” of 10 times operating cash flow, and is the current value of existing operations. (The current value of existing operations can also be expressed as the sum of the capital invested, plus the PV of the current EP into perpetuity without growth).
If we assume a growth case where operating cash flow grows at a rate of 5% per year, forever. Then the above case can be valued on a present value basis at $100 divided by (10% - 5%), or $2000. The growth case implies a multiplier of 20 times and this often illustrates a price level common in the share market, where many share prices imply a multiplier of 20 times or more.
In this example, the market has based one half of the share price on the present value of current operating cash flows, forever, and the other half on profitable growth expectations above this level – i.e., fifty percent of the value is based on the current value of operations, the remainder is based on future growth options (FGO).
The FGO amount includes not only expected growth, but also implicitly values any real options. For example, the 5% growth assumption might really be a proxy for a 90% likelihood of no growth, and a 10% chance of 50% growth.
Strategically, enterprise value is not maximised solely through the maximization of current operations value (COV) but through the simultaneous maximization of the sum of both current operations value (COV) and future growth options (FGO), including the value of real options. (Refer to appendix for discussion on Real Options)
While the valuation of Internet shares might be interpreted as proof of a patient and forward-looking share market, leading business strategists are concerned that many of today’s corporations remain overly fixated on the near-term. The implications for business strategy, financial policy, and financial management/compensation strategies are far-reaching.
The various ways of expressing Total Market Value or Enterprise value which is the sum of current operations value and future growth options (including real option value) are as follows:

What are the implications for its net present value? If the miss has no implications for the future, the value of share is reduced by only one dollar. A miss expected to persist for four quarters is worth four dollars. A once off permanent miss, using the example multiplier of 10 times, is worth 40 dollars. If the shortfall has implications for growth opportunities, we might expect a much larger impact, like our example with a 20 times multiplier. A one-dollar shortfall on the quarter every quarter from now on can thus be worth a 40-cent reduction in the perpetuity value, and another 40-cent reduction in growth value – an 80-cent impact!
Managers typically have significant financial incentives to do just about anything to avoid falling short. And aggressive accounting practices often understate how bad things really are (e.g. revenue recognition, offsetting gains and losses, and reversals in acquisition, restructuring, warranty, bad debt, inventory and actuarial reserves).
So when a company does miss by a dollar, it may warrant a more dramatic, downward revision of expectations and Future Growth Options (FGO).
Matrix Analysis - to determine what the share price really means
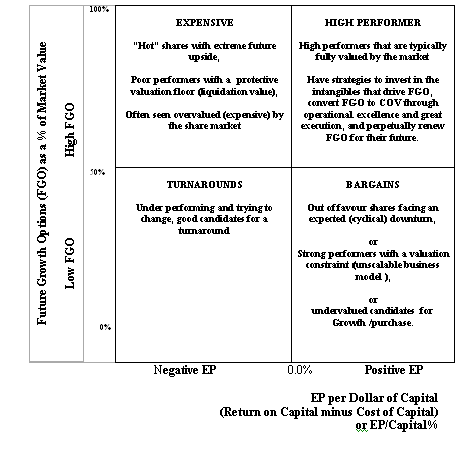
When looking at the results of this analysis, it is useful to look at them on a Matrix showing both financial economic performance (EP) and future growth options (FGO) as shown below. The components of tis analysis can be used to explain valuation and market expectations about the company.

As an illustrative example using public data from 1999-year end to show the relationship discussed here are some examples of what is implied by the June 1999 year end share price. See Appendix 2 for more detailed analysis of the data.
(FGO = Future Growth Options, MV=Market Valuation, EP=Economic Profits, Capital=Economic Capital - which is Book capital adjusted).
|
Company |
FGO/MV % |
EP per $Capital% |
1999 status |
|
Just Jeans |
1% |
Out of Favour |
|
|
Goodman Fielder |
5% |
(1%) |
Turnaround |
|
CSL |
72% |
2.6% |
High Performer |
|
Faulding |
35% |
1.1% |
Undervalued |
|
Foodland |
8% |
1% |
Undervalued |
Appendix 1 Real Options impact on Value – a modified approach
For many firms the market value will incorporate some "real option value". Sophisticated investors do take account of this value. Since investors have factored "real option" value into the value of the firm, it is arguable that the firm's future EP stream must compensate investors for that component of value in order for investors to achieve competitive returns. The Components of a firm's value, including "option value" can be shown as follows:


Appendix 2 Example of the detailed Economic Analysis
