

Let’s assume, like most non-technical investors, you are holding stocks and the market is going down. You are worried but you consider yourself a long term investor so have not sold anything. But now you are getting fearful that we may have another GFC , that we are in bear market and that maybe you would be better off selling and coming back later, hopefully when the stocks you sold are cheaper and you can buy them back.
How do you do that? How to time the market. The answer is here.
STEP ONE – ACCEPT THAT INVESTORS HAVE WEAKNESSES
Investors, or at least fundamental analysts, are good at certain things (in theory). They include:
- Identifying companies that make money (and that’s the root of it all in the long term).
- Identifying rubbish companies.
- Identifying good management.
- Identifying sector trends.
- Portfolio theory.
…and most of this analysis is done with one aim in mind, to decide which stock to buy and there’s a lot of value in that.
But having decided ‘what’ to buy most fundamental investors, long term investors, value investors and income investors simply throw their hands up at the question of ‘when’. They declare that you can’t time the market and more often than not just tell you to buy ‘now’ or palm off the responsibility by saying something like “seek professional advice’. Ultimately they do all this great work and then trip at the last hurdle and simply rely on the hope that their short term analysis is borne out in the share price in the long term.
It’s a bit pathetic really. Let’s face it, this whole game is about ‘what and when’, not just ‘what’ and if you are not able to have a stab at ‘when’ you aren’t much use to anyone.
Too much advice, and in my opinion one major flaw in a lot of full service broking advice and financial planning advice, is that it focuses on what to buy and whenever that conclusion is made that’s when they buy.
For instance, how many brokers get on the phone the day after the Commonwealth bank results, when their analyst has just published the mandatory post results research which includes a predictable BUY recommendation and advise their clients to “BUY”. Hundreds of them. And what do the clients do, they buy.
Now talk to me about why that was the right moment to buy. I’ll tell you why, because that was the day the analyst had to write the research, that was the day they spoke in the morning meeting about it (attended by hundreds of advisers) and that was the day all the advisers, like zombies, got on the phone and told their clients what the analyst wrote.
But there was no ‘timing’ effort that went into that trade at all. The timing was dictated by the results date. That’s all. So what are the odds of that purchase being successful. Low.
We all have to do better than that and step one is for the people who have never bothered to understand technical methods or trading skills and who consider themselves to be long term investors to open their minds to criticism because there are a few things most long term investors aren’t much good at:
Namely:
- Timing the market. They declare that it can’t be done. How ridiculous. Because of that they are going to wear the next GFC right on the nose.
- Selling. They don’t. They don’t know how.
- Being disciplined. They don’t have any discipline. They’ll watch stocks get destroyed without doing anything about it and the bigger the loss the more likely they are to persist with it.
- Being vigilant. They ‘set & forget’. Forget! About their money! What planet are they on.
- Having a Trading Plan. They don’t have one. Incredible. Net result they let their losses run and cut their profits. The complete opposite of what they should be doing.
- Being emotional. They believe the things that make them feel good and disregard the things that make them feel bad. They listen to stock tips. They invest on the thinnest of evidence. It’s not rational.
- Being Lemmings. They get in when it’s obvious and get out when it’s obvious. Put another way, they buy at the top and sell at the bottom.
- Being wrong. Do you know how many flawed assumptions go into fundamental analysis, into those high brow calculations of intrinsic value? Rubbish in, rubbish out, no matter how smart the calculation.
STEP TWO – UNDERSTAND TRADERS
A common misapprehension about traders is that they are short term, rely entirely on technical analysis, know nothing about companies and aren’t interested in dividends of franking. On the contrary, traders have a lot of strengths:
- Traders are not just technical analysts, they are traders (there’s a difference) which means they have trading skills. These skills are universal and are as useful for investors as they are for traders. Some technical analysts never trade, they just fuss over formulas and principles. Traders are different, they live in the real world and trade. They are quite separate and there is much you can learn from them.
- Traders are not necessarily short term. Trading techniques can be applied over any time frame. Apply them over minutes and hours and yes it is gambling. Apply them over days and it is trading, apply them over weeks and months and it is investing. You can easily adapt trading skills to investors.
- Traders have exactly the same ambition as a long term investor, as Warren Buffett even, the ambition to buy a stock that goes up forever. They are doing exactly the same thing.
- Traders have a trading plan and because of that they never miss a night’s sleep.
- Traders are unemotional. They know what they are going to do at all times because from the moment they buy a stock they have a system.
- Traders are decisive. Traders never prevaricate, they never agonise, they know what to do, they decided way before the trade was even opened.
- Traders are honest about their abilities. They know that making money in the stock market is about buying stocks with a high probability of going up. Its not about predicting the future. No-one can do that.
- Traders are not proud. They know that things will change, that they will get themselves into a pickle. The difference is that when they do they act, they don’t stand by some grand but flawed declaration about the future through thick and thin.
- Traders are not lemmings. On the contrary, they see the market as a battlefield, as combat, one on one. They know they are in a war with the herd and because of that they retain an independence of mind and action.
- Traders are commercial. They see trading as a business and they analyse their success and failure like a business. They constantly analyse, adapt, educate and improve.
STEP THREE – FORGET THE MARKET
Turns out that the way to time the market is not to try to time ‘the market’ but to try to time individual stocks and in doing so ‘the market’ timing will take care of itself.
Let’s assume you have 20 stocks.
In order to cross the line from paralysed investor to disciplined trader you first have to consider all your holdings as individual trades not as one portfolio because that’s what they are. As any trader will tell you, you don’t hold ‘the market’ you hold a collection of individual trades and every stock presents its own individual trading challenge, its own separate battle.
No trader is smart enough to make one decision that will be successful for every stock at the same time so instead you are going to make 20 decisions on 20 stocks using 20 price charts assessing each one on its own merits.
Half the reason most investors never sell is because it’s close to impossible to make a ‘grand declaration’ that the market is going down and sell everything in one go. It is too big a decision, especially for advisers. Most advisers operate within a compliance envelope which means they have to be able to defend every piece of advice they give. Selling everything is too big a call, too radical as advice, and because of that they never make it on a client’s behalf, even if they think it. Instead, they and their clients prevaricate and hold and as the losses mount they get even more buried and even less likely to sell.
Treating each stock as an individual decision breaks the process down into a lot of little decisions, into bites that are much easier to take and as a consequence you are far more likely to make them.
You will also find without realising that by taking a stock by stock approach you end up timing the market without thinking. If you watch twenty stocks and one by one they trigger your stop losses and you sell them, by the time the average man looks up in fear and says ‘its time to sell the market’ you will find, through a series of 20 individual stop losses being hit, that you have already sold it. The stocks spoke, you listened and you exited the market without the need for any grand declarations and you did it on time, ahead of the crowd and you never even knew you’d done it until you had. That’s why we break it down into individual stocks or trades. Because the stocks are the market and they will tell you what to do way before CNBC persuades you.
It is incredible that we spend so long talking about ‘the market’ really (the ASX 200 index for instance) when almost nobody actually trades the index and when you consider that just 20 stocks account for 50% of the index and 50 stocks account for 80% of the index you begin to realise that unless you hold those stocks talking about ‘the market’ is a bit irrelevant.
Far better you deal with ‘stocks’, with the stocks that you hold. Forget the market. It is the tool of commentators, the media and fund managers who use it as a benchmark. You have no benchmark so let’s be realistic, forget the market and talk about stocks.
STEP FOUR – TRADING PLAN
OK now we’re into it. How do you know when to sell a stock? As any trader will tell you, you have a system, a mechanism that tells you when to sell. This mechanism is embodied in a trading plan that is decided upon before you even buy a stock. I’m not about to set out a whole trading plan, there are books written about them that you can buy, but the basics include:
BASIC TRADING PLAN – Documenting the following:
- Setting your goals
- Deciding on the entity or structure you are going to use to trade.
- How to trade – online, full service.
- Deciding on the hardware and software you are going to rely on – which charting software, which price service, which newsletters (Marcus Today obviously).
- Committing to an education – books, online resources.
- Deciding your trading style – Are you going to trade forex by the second or stocks on the back of weekly data (which is our preferred style and the most suitable for investors). A lot of that depends on what you can realistically fir into your life. Some traders using weekly date (which is slower moving) reckon they can get their trading down to an hour or two a week… so you can be a trader and still have a life. Set a routine that fits in with your lifestyle.
- Technical set up. Decide what technical indicators are you going to use, track, adhere to and on what timescale. Are you a short term or long term investor?
- Money Management – position sizing. Basically a discipline about how much of your total capital are you prepared to commit to a trade and how you monitor and manage your risk.
- Trading system. This is where you decide how you are going to trade, what your triggers are for entry and what your post purchase system includes and for the purposes of deciding when to sell, what sort of stop losses do you use and how you structure them.
- Record keeping. Performance measurement and attrition.
- Constant tweaking to improve the experience.
STEP FIVE – STOP LOSSES
So finally let’s deal with the Stop losses, this is the essence of timing stocks and you will find that once you have developed a stop loss mechanism you could buy pretty much anything and everything after the purchase becomes systemized. The system takes over. You have absolutely nothing to worry about, no reason to stay up at night and no reason to stress. All you have to do is monitor the trade and do what the system tells you.
But that’s ridiculous I hear you say, if it was that easy we would all be millionaires. Well no. Trading systems are not about making easy money they are about tilting the odds of success in your favour by controlling the outcome and minimizing losses. You will still need to buy good stocks at the right time and that’s where you need to combine the fundamental stuff with your new found technical skills. But let’s get onto stop losses.
What are they?
An order that automatically closes your trade at a predetermined price or trigger point.
A stop loss serves the dual purpose of limiting losses whilst at the same time providing a mechanism to take profits.
It also serves the background of short circuiting debate and emotion whilst providing certainty.
Requirements: Forget the concept of “portfolio”. Think of every stock you hold as a separate trade. Preset a stop loss for each individual holding, preferably when you are unemotional and in possession of a clear mind. The time of purchase would be a good time (the latest time) but any time will do.
THE MECHANISM:
There are loads of them. Here are a few:
A trailing flat percentage– When a stock falls x% from the highest price it hits post purchase, sell it. Otherwise known as a rolling stop loss. This would be the most common stop loss. It takes a bit of work (checking daily or weekly to see the highest price it hit and recalculating the stop loss – usually has to be done manually) but it allows your profits to run and cuts losses. Most (hard core) traders use 2% – that is to say they risk a maximum of 2% of their trading capital on any one trade. In other words, on $100,000 of capital (a portfolio of $100,000) they would cut a trade that makes a $2,000 loss. Notably this is not the same as a 2% drop in share price. If they have put $10,000 of the $100,000 portfolio in the trade it could be a 20% loss on that one trade ($2000 of the $10,000).
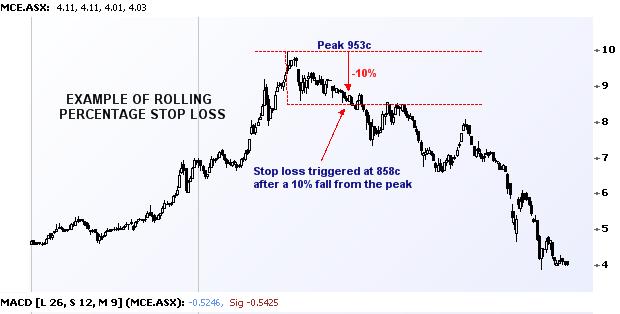
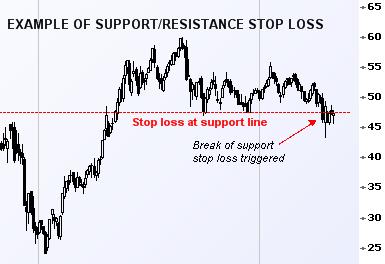
Chart or technical based stop losses - Another way is to set stop loss levels is by reference to a chart rather than a percentage. For instance if you are trading price breakouts (buying stocks that break a resistance level) the stop loss can be set at the price at which it breaks out and so the resistance level that was broken serves as the stop loss level if it reverses again. A lot of technical traders will use support and resistance.
The Marcus today newsletter for instance sold out of all its long term portfolio stocks and is now in 100% cash because with the experience of the first GFC under our belt we set what we called ‘disaster’ or ‘catastrophe’ stop losses on all our stocks using support and resistance. These were wide stop losses set on long term positions designed to trigger a sale when a long term downtrend developed. When the stocks broke out of the bottom of their two year trading range, breaking the lows hit in 2010, breaking resistance, we considered that enough of a message that the long term downtrend was established and sold them. You can read about that in our Portfolio Section. Only the rump of the portfolios were left by the time these stop losses were triggered, most stocks had already been stopped out using ATR stop losses on weekly data and we had decided on May 4th that we were going to pare back our holdings to reflect our concerns about the market so by the time our stop losses were hit we were only holding and selling the most defensive of stocks.
Volatility based stop losses (ATR stop losses) – This involves setting stop loss levels with reference to the volatility of a stock so you can trade without being stopped out by a ‘normal’ fluctuation. A volatility based stop loss calculation allows you to apply a narrower stop loss for a boring stock and a much wider stop loss for a very volatile stock. The ATR method helps you calculate that percentage. Simply put this means accounting for how volatile a stock is when setting a stop loss. Volatile stocks need more room to move so you set your stop losses a bit further out. And if you find yourself setting very wide stop losses because of the volatility and you are still uncomfortable with the loss the stop loss might imply then you are trading the wrong stock.
MARCUS TODAY stop losses - In the normal course of events Stop losses on our system are based on a multiple (usually 2-3x) of ATR (Average True Range) which is basically a measure of how far a stock moves on average in a day or week depending on whether you are an investor or trader – traders might use daily data and investors weekly data.
(If you are trying to find out what the ATR is, although you could do it yourself on Excel on a formula it is basically unnecessary when the most basic of chart/technical packages - we use Iress, Metastock, OmniTrader, VisualTrader - will spit it out for you on any variables.)
In a long term portfolio you would generally use weekly data and 2 x ATR (fairly common) as your stop loss level. It is the equivalent of cutting a holding when it falls twice the average weekly move from the purchase price or from the highest price since purchase. The stop loss rolls up when the price does. It never rolls down.
Some people use 3x or 2.5x and some change the ATR multiple when the stock is in the money etc etc. There are a lot of variables but no one formula is better all the time.
Other stop losses:
- Technical stop losses– Using a particular technical indicator to determine a stop loss (sell on a MACD signal for instance, or RSI signal, or a break of support, or a break out of a channel). You can even combine a few technical indicators, weight them, and use them to indicate a change in trend and position a stop loss for you Initial stop loss- A stop loss that is different from your system and is used until the price moves away from the purchase price by a certain margin at which case the system takes over.
- Breakeven stop loss– Sell when it hits the buy price.
- Dollar based stop loss– I’ve lost $1,000, that’s enough.
- Percentage of capital stop loss– I’ve lost 10% of my money, I’m out of here.
- Trailing profit stop loss– When the trade is in profit you take profits when it falls a certain percentage or multiple of ATR or number of cents from the highest price it hits.
…and you get some more obscure ones like a time based stop loss (sell if its done nothing for a year) and
I operate a holiday stop loss….I always sell everything before I go on holiday. I once ruined a family holiday watching stocks…it didn’t go down well.
CONCLUSION
There are a lot of ways of setting stop loss levels. As noted, a flat percentage is very basic. But the core to it is to make the decision to use them rather than rely on guts, set your stop loss levels early, set them for each individual stock and stop thinking in terms of “the greater portfolio”.
Of course all of this takes a bit of monitoring and this is where most of us fall down. But it is not as complicated as it might seem.
All you need do is get a list of your stocks, a list of current prices and next to that a column defining your stop loss levels. Every so often update the current prices and compare to the stop loss price. It’s that simple.
If you consider yourself a long-term investor and your concern is Armageddon rather than a correction, you can be a bit relaxed. Set your stop losses nice and wide and update current prices once a month or whenever the news “vibe” suggests something could be going wrong. Dance to your own tune.
If you are more concerned about short-term fluctuations check in more often. Hard core traders use live prices. The average trader would check against daily closing prices. Other investors might check stop losses against weekly prices. Whatever suits.
But the main thing is to at least pay some attention to what’s happening and have an understanding with yourself that you will take action when a price falls a pre-determined amount, and stick to your guns.
If you work stop losses diligently then when the market falls over you will find you have sold each stock on its own lack of merits as it turned down and have ended up in cash, where you should be, without having to make some impossibly big call on all your holdings (your portfolio) at once.
Yes, you will make mistakes. Yes, you will sometimes sell stocks that then go up again. But nine out of ten stocks that are going down are going down for a reason and are likely to keep going down. And if they don’t, don’t worry about it. The game is to learn what works and whatever you do it has to be better than setting and ignoring.
Cash is power, taking a loss puts you in the eye of the storm, gives you clarity and you know, you can always buy back.
This was/is a huge subject to consider so let me leave you with a core tenet: when it comes to controlling losses anything is better than nothing – and if your mechanism doesn’t work, you can always change it.
It’s up to you and the reality is that the detail of the mechanism, whilst some technical traders will agonise over the best formula, is not crucial. For the long term investor it is the simple fact of having some sort of discipline that drives some decision making rather than the calculation of some miraculous stop loss level that makes you money. It won’t because for investors it is not so much the stop loss level that matters but the commitment to act should a stock fall.
So if you are still worrying about the market do this now:
- List your stocks.
- Write down the current price.
- Decide on a stop loss mechanism.
- Write down a stop loss price next to the current price, a price at which you will sell.
- Monitor and adjust your stop losses (depending on your formula) every day or week.
- Sell when they hit the stop losses.
- Enjoy earning 6% and sleeping like a baby whilst Europe and the US implode.
Then all you have to do is keep watching for the day when the market (the stocks) reverse.
Marcus Padley is a stockbroker with Patersons Securities and author of sharemarket newsletter Marcus Today. For a free trial, go to www.marcustoday.com.au