VisualTrader Set up for End Of Day                                                      
Some help to get you going using VT  End of Day
Note references to installing OmniData in the user guides (download via the online HELP option) should be ignored
Watch the Get Started Videos before you do anything else > click here
Once you open the software for the first time it will load a US Map and expect data from the US >>So here is what you need to do
 
The following check list will ensure you get going for Australia
go Edit Data Settings and set to User Data
 
 
Go Edit Symbol List  >>  to set up links to your Metastock database
  • If you are using PremiumData just review the set up video to ensure you have installed the software and data correctly in particular set up the shares to be in one folder.  Click here for setup videos
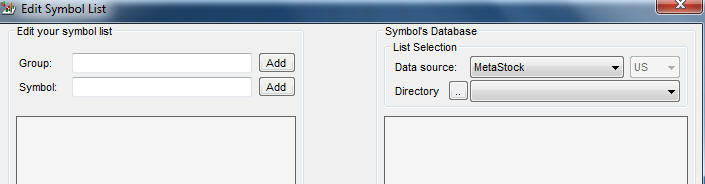
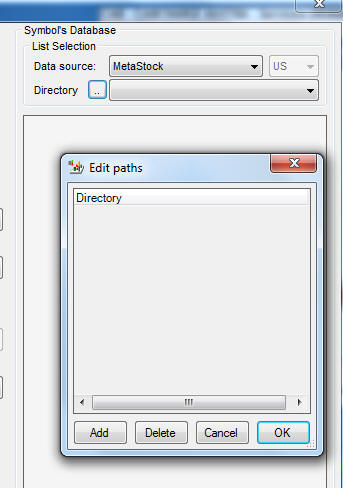
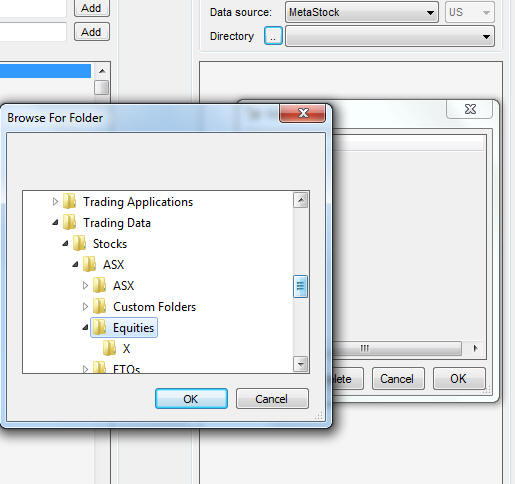
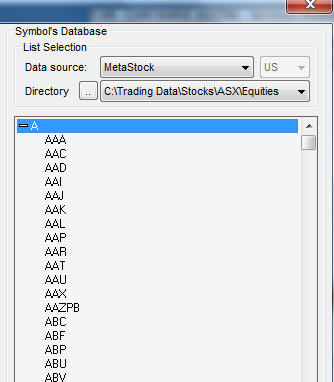
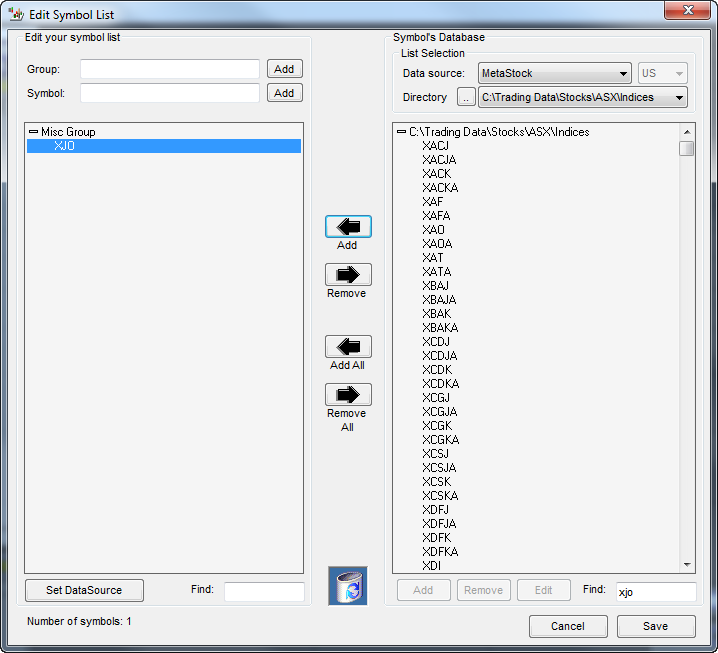
  • Make sure data source is Metastock, Click on the directory  to set up a data path to your data
  • Then make sure you click on the directory button and find the directory where you data is saved - add this directory. When done it must show a directory name as in this example
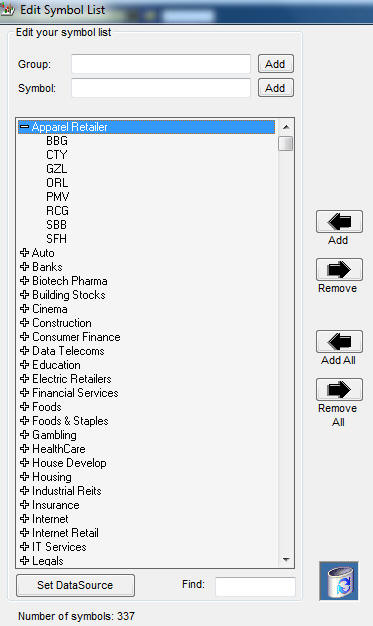
  • To set up your Symbols List - add a group name then key in all the symbols from your Metastock data base into each Group , use the find box at bottom to select
  • then SAVE
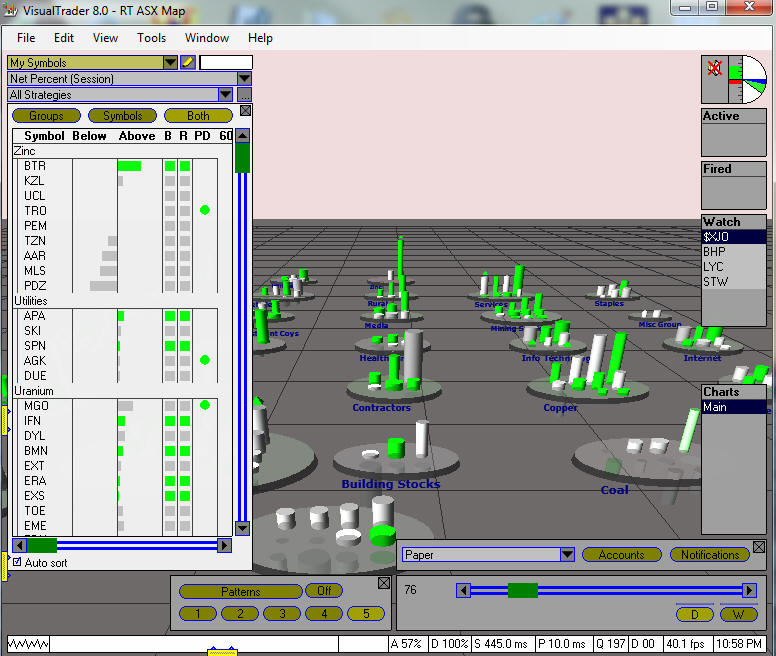
  • Following below is a sample of shares by sector
This is how it should look once updated
Edit the path so the software can access where you have saved the ASX data
Here is an example
Once done it should look like this provided you updated your premium data to consolidate the data base
Now you can set up your Groups and individual shares in each group ( make sure you do this carefully be group) 

- Click here for help in setting up your industry section including sample share lists by industry

 
Go Edit Strategies  >>   select strategies available to you
Select the basic strategies to start or those associated with any modules you purchased 
 
go Edit Time periods and add days and weeks
Make sure this is set for D or W   >>> not to 5 or 15 Minutes as this only works in real time mode
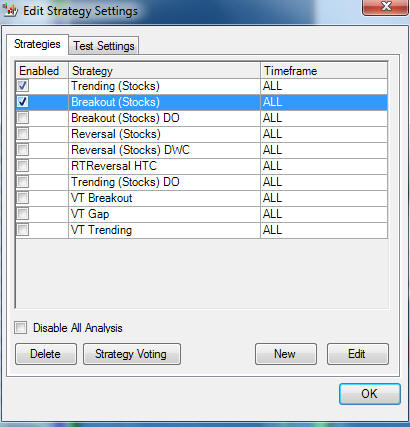
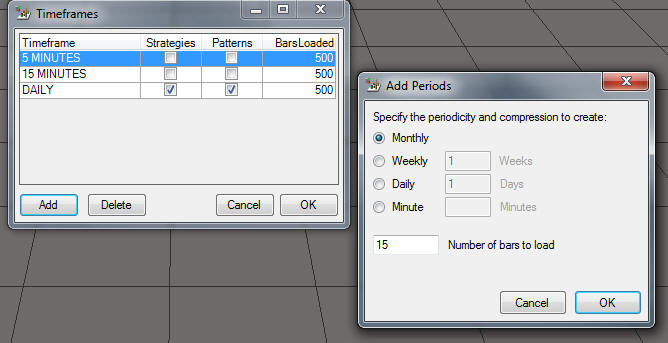
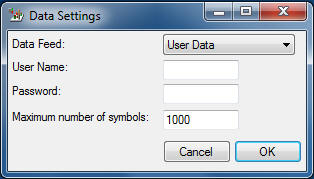
  • You will not get any output on the charts if you select 5 m or 15 m as these are for real time only
  • you can add daily, weekly and monthly plus other non time based periods
  • Bars relate to the number of ticks you want to show and keep data for. Suggest you start by using the defaults.
  • Very important >>> make sure your data manager (download) has been run otherwise the map will not complete
Example of a completed map
 
 
If you want to get a map of key indexes
You should start a new map, this is better so that you avoid a bias which can occur with the leading indicator if you include data which is already calculated by the leading indicator. Just select a new directory which contains the indices as in this example
Secret Sauce - Set Up instructions
(Secret Sauce) The Relative Momentum transform/measurement symbol 'SPY' may now be changed to another symbol such as XJO. (note no $ sign required) This is found under Tools -> Options -> Data.

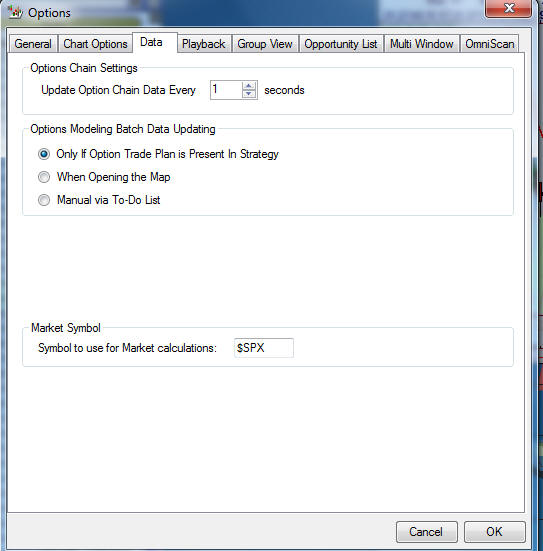
You need to change $SPX to XJO and add this to the opportunity list

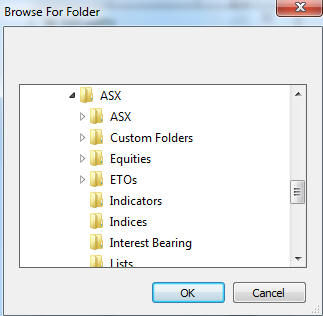
You need to ensure you add the Australian index data base to the Symbol list


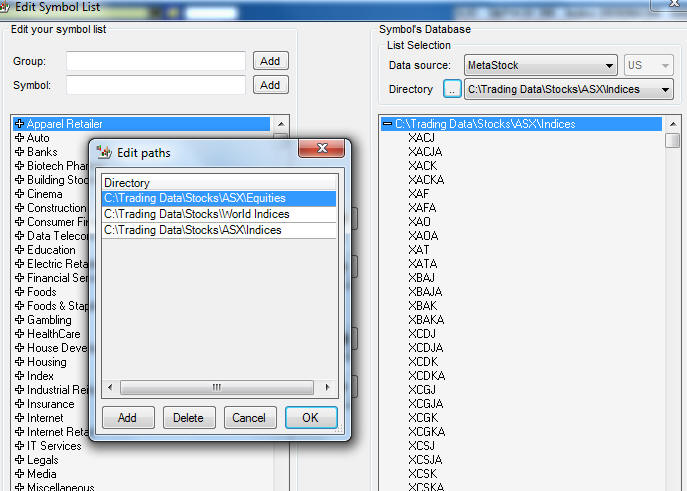
The index folder is located here