Non time based charts are charts that form a new tick on specific price or volume changes rather than time based increments. The scale on a non time based chart does not reflect seconds, hours, days or weeks but it ticks on a non time based parameter like a price move of a certain percent or say a number of increments of ATR (Average true range). There are a number of non time based charts:
- Renko charts - See below
- Point & Figure charts - Point and Figure charts are formed by stacking columns of X's and O's to represent price movement. A column of X's represent rising price while a column of O's represent falling price. They are good for filtering out noise and to identify uncluttered support and resistance.
- A new point and figure bar is formed when price reverses direction and moves up or down by a designated value like say 10c.
- Volume bars - Candles show high low and close but are only produced when a certain volume of shares are traded.
- 3-Line break charts - Using closing prices - You start with a red or green bar depending on whether the price today is above or below yesterday's close. A second new bar forms when the close is above or below the high or low of the day before. A third bar and subsequent bars form if a close is above the high or low of the previous two bars.
- Range charts - Range charts produce bars only when a stock moves by a certain range - they are used to help filter out market noise and are particularly helpful during periods of consolidation - A bar is formed when
- Tick charts - Tick charts display a bar only after a certain number of transactions (trades) are completed regardless of size. In a market now ticking trades in 1 share thanks to computer trading they are pretty ineffective.
 You
can use non time based charts to run technical systems in the same way
as you can on time based charts. We are going to explain RENKO charts.
You
can use non time based charts to run technical systems in the same way
as you can on time based charts. We are going to explain RENKO charts.
RENKO charts are non time based charts that are only concerned with price movement. Renko charts are "time independent" charts that do not have constantly spaced time axes. They are named after the Japanese word for bricks or "renga". A renko chart is constructed by placing a brick in the next column once the price surpasses the top or bottom of the previous brick by a predefined amount. We're going to use a number of ATR for instance so each brick has a pre-determined size (say a move of 2 x ATR. If prices move more than the Brick Size above the top or below the bottom of the last brick on the chart, a new brick is added in the next chart column.
White (hollow) or green bricks are used when the direction of the trend is up, while black or red bricks are used when the trend is down - much like candles. Only one type of brick can be added per time period. Bricks are always with their corners touching and no more than one brick may occupy each chart column.
Note - Prices may exceed the top (or bottom) of the current brick because new bricks are only added when prices completely "fill" the brick. For example, for say a 5c chart (if 1 x ATR is 5c say), if prices rise from 98 to 102, the green brick is plotted that goes from 95 to 100 BUT the green brick that goes from 100 to 105 is NOT DRAWN. The Renko chart will give the impression that prices stopped at 100.
Renko charts using the ATR method - The "Average True Range (ATR)" method uses the value of the ATR indicator to determine the brick size. The ATR indicator is designed to ignore the normal volatility of a stock and thus it can "automatically" find good brick sizes regardless of the value or volatility of the stock selected. ATR with a value of 14 is the default value for Renko charts and this is what we'll use.
Interpretation - Green bricks are bullish, red bricks are bearish - that's the simplest interpretation of Renko charts. Renko charts are good for identifying trends and trend direction because they screen out moves that are less than the brick size. They get rid of the noise. Consequently trends are much easier to spot and follow. In order to avoid whiplash periods, some people wait until 2 or 3 bricks appear in a new direction before taking a position. If you were using 1 x ATR bricks obviously a change of trend showing two red bricks after an series of green bricks (an uptrend) would suggest the trend has ended and the stop loss (2x ATR) hit.
Renko charts are also effective for identifying key support/resistance levels. Trading signals are generated when the direction of the trend changes which is apparent when the bricks change colours.

The benefits of a Renko chart:
- Simple - Patterns are more clearly identified.
- Trading signals like trend changes and line breaks are easier to spot.
- Less noise.
- Charts much easier to read.
So let's get going:
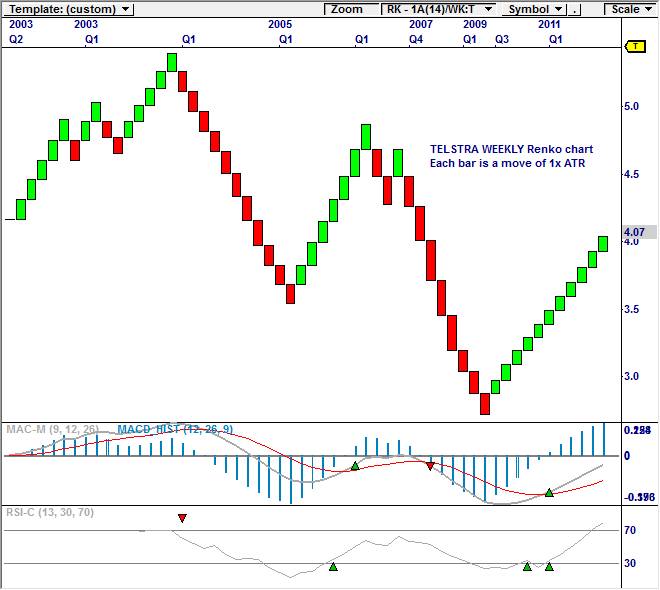
This is topical - It is Telstra - Telstra is down 8c today as UBS downgrades to NEUTRAL from buy with a 400c target price. Despite that they say "Despite cutting Telstra to Neutral, the stock remains fairly
attractive in the current environment." The Renko chart is showing ticks (bars/bricks) every time the stock moves 1x ATR. So effectively if the stock shows two red bars it is 2x ATR from the top and under the Marcus Today standard stop loss system you would think about selling because our stop losses are set on a rolling 2 x ATR from the top most price.

You can see that the uptrend is clear as are the support and resistance levels. You will also see where a 2 x ATR stop loss saw us (unfortunately) sell our recent trade because it dropped more than 2 x ATR. the lesson from that is that we would have been better off trading a weekly rather than daily chart. Here is the weekly chart showing the bigger trend remained intact.
As always - it's a lot easier in hindsight. Success in trading is a combination of two things - getting the trend right and getting the time period right.
In the current market volatility the tendency is to push the time period out from Daily to Weekly otherwise you get too many signals and miss the bigger trend.
Here's the Renko chart of the ASX 200 since 2003 showing a bar every time it moves 1 x the weekly ATR:

Here is the same chart showing the ASX 200 index ticking every time it moves 1 x the DAILY ATR. As you can see...if you bought the same way as you sell...when the market goes up 2 x ATR then the market is a "BUY and trending up. Trading is all about your timescale.

Here is a topical stock - Bradken had results yesterday and jumped 11%. Brokers are saying BUY this morning. They had a profit warning in April and halved. Yesterday's results were OK - If you buy on a rise of 2 x ATR then it is 4 ATR off the bottom and is a BUY.

Here are another topical few stocks - All using a Daily ATR value each bar showing 1 x ATR moves. Notice the timescales are not constant.
Resources - BHP and RIO have shown 1 uptick - not enough to BUY but "On watch" - FMG in downtrend:


A couple of Banks - going along nicely:


And some of the stocks we mentioned yesterday - all in uptrend:


 THIS
INFORMATION IS CRITICAL FOR ALL TRADERS AND INVESTORS WHO ARE
INTERESTED IN TRADING WITH NON-TIME BASED CHARTS.
THIS
INFORMATION IS CRITICAL FOR ALL TRADERS AND INVESTORS WHO ARE
INTERESTED IN TRADING WITH NON-TIME BASED CHARTS.
Non-Time Based Charts form according to price and volume movement – not according to fixed increments of time. Therefore, it is entirely possible for a NTB chart to not show current price. This is critical to understand when trading NTB charts because your position could have a loss when it looks like you have a gain.
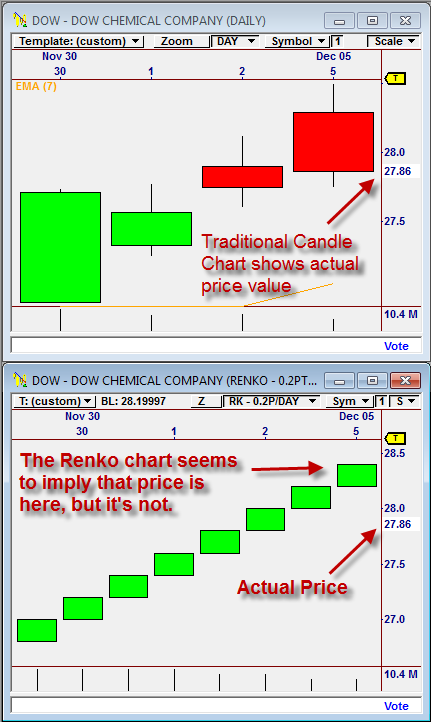
An Example (DOW)
Take the example to the right for DOW. The Candle Chart shows the price at the bottom of the red candle, at 27.86. The RENKO chart, however, shows an upward bar at about 28.4, which seems to imply that price closed at this value. But it did not. Price closed at 27.86 on this day.
The RENKO Chart is waiting for a specific amount of movement
before it draws a bar. Even though the symbol has dropped in
price, the RENKO chart will not show this until price has dropped a
specified amount below the prior low in the RENKO chart.
If we had bought this stock at 28 on the 2nd of December and
glanced at the RENKO Chart on December 5, we might think we have a
profit but we actually have a loss. Note that the RENKO Chart
shows current price highlighted on the price scale. But it is
easy to miss this.
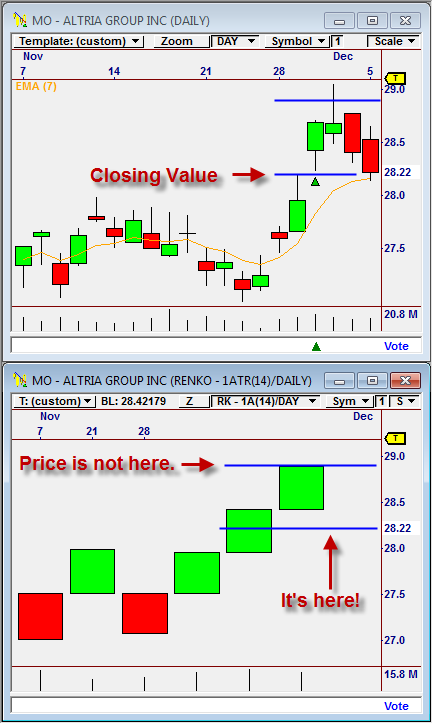 Another
Example (MO)
Another
Example (MO)
For very large RENKO increments relative to price movement, this effect can be much more severe. Here are both Candle and RENKO Charts for MO. We easily see in the Candle Chart that MO closed at 28.22. However, the RENKO appears to indicate that the market closed at 28.9. If we had bought at 28.5 we might think we have a profit but would actually have a loss.
How this affects trading
If you trading in an NTB Chart and using Virtual Stops (indicated by a “V” to the right of a Stops Chevron) your Stops will only “see” the bars of the NTB Chart. They will not see or react to the actual price. So, price CAN AND WILL move through your stop and NOT stop you out of the trade, potentially generating an unexpected, large loss.
This only applies to Virtual Stops. If you employ Broker Stops in your RENKO Charts, they WILL react to price and exit your trade when price violates the stop level.
Why would anyone want to trade with NTB Charts? NTB Charts (Renko, 3-Line Break, Point & Figure, etc.) are useful because they filter out noise and are not responsive to adverse price movement. With NTB Charts, Virtual Stops are not “seen” and acted upon until a bar actually forms in the NTB Chart that violates the Stop Level. This can have the positive effect of staying in a trade longer than would otherwise have happened, at the potential risk of generating larger losses than if we used regular time-based charts (such as Candle Charts, Bar Charts, Line Charts, etc.)