| Heikin- Ashi Charts |
|
Heikin-Ashi and daily charts should be used together to improve your
understanding of share price direction. Strategies can be run against
these charts. The following seminar will give you more insight. |
|
|
|
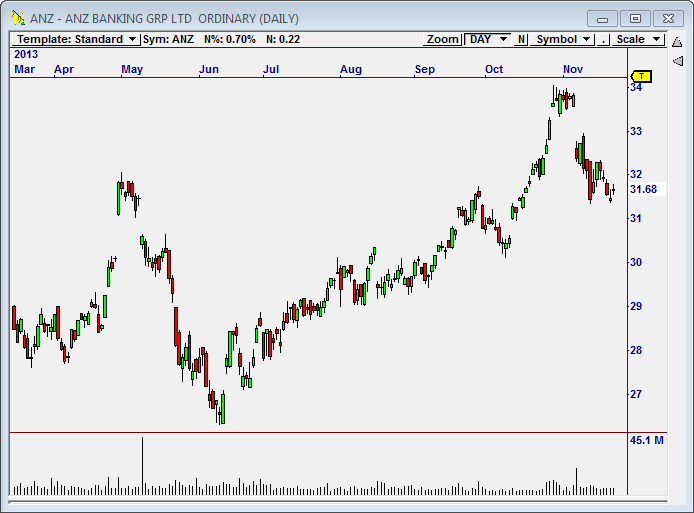
Here is an example of a daily chart of ANZ |
 |
|
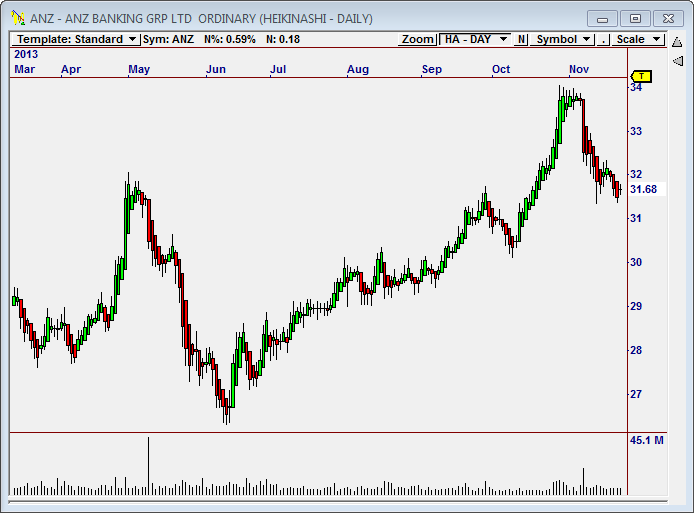
Here is the same chart using Heikin- Ashi setup |
 |
|
|
|
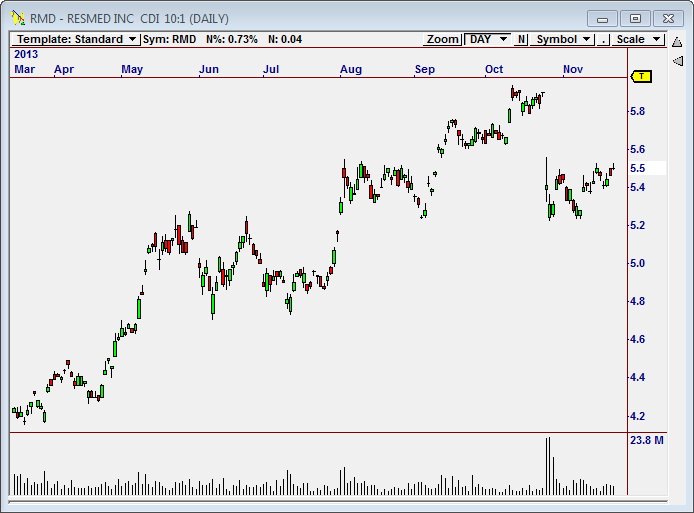
Here is an example of a daily chart of RMD |
 |
|
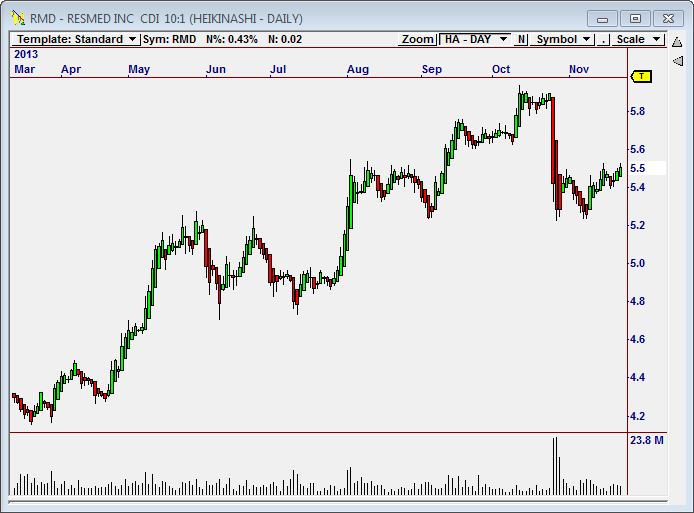
Here is the same chart using Heikin- Ashi setup |
 |
|
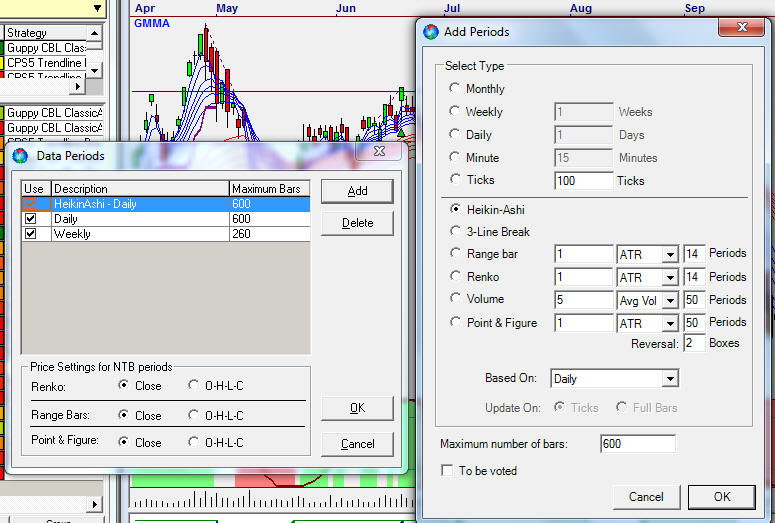
How do you set up the chart in OT2104 ? |
|
To plot a chart go EDIT > DATA PERIODS > ADD and tick the HA chart option and
the vote box. You will note from this option box you can also use this
to create other non time based charts such as RENKO etc. |
 |
|
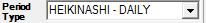
then select the period type for the chart as follows: |
 |