Overview Guppy Multiple Moving Averages                                                                                     
The Guppy multiple moving average (GMMA) by Darryl Guppy is a set of six short term and six long term exponential moving averages

His standard periods are 3, 5, 8, 10, 12 and 15 days for the short averages, and 30, 35, 40, 45, 50 and 60 days for the long averages.

Guppy's approach is look for compression of the averages (the lines coming together) in each group as signalling a likely trend change; and for steady parallel or expanding lines as a continuing trend. He emphasises that the idea is not a moving average crossover system.


Application

Applied to understand the nature and character of the trend. Used to assess the degree and extent of trading activity. Excessive trading activity can destabilise strong trends. Trend analysis enables more effective selection of appropriate trading strategies such as breakout, trend continuation etc. Can be applied to long side and short side trading. Can be applied to intraday trading. Also used for longer term investment style analysis.


Tactics

  • Join established trends at points of price weakness

  • Join established trends breaking to new highs

  • Trade breakouts using rally dips and rebounds

  • Trade downtrend rallies as rallies rather than trend breaks

  • Recognise trend breaks as they develop


Rules

  • Degree and nature of separation in the long term group define trend strength and weakness

  • Degree and nature of separation in the short term group define the nature of trading activity.

  • Degree and nature of separation between the two groups of moving averages define the character of the trend.

  • Compression shows agreement on price and value.

  • Compression of both groups at the same time indicate major re-evaluation of stock and potential for a trend change

  • Trade in the direction of the long term group of averages

  • The relationships between the groups provide the necessary information about the nature and character of the trend.

  • Do not use as a moving average crossover tool


Advantages

  • Enables effective analysis of the trend environment

  • Improves selection of the appropriate trading tactics 

  • Better understanding of trend strength

  • Effective evaluation of unusual price movements, such as dips and spikes

  • Effective understanding of trading activity and behaviour


Disadvantages

  • Not effectively applied to  trend less stocks

  • Cannot be applied to all trending stocks

  • Do not use as a moving average crossover signal


The nature of the Trend
Understanding the nature and character of a trend gives us an invaluable advantage in making a trading or investment decision. The classic ways of understanding trend behaviour are a straight edge trend line and a crossover of two moving averages.

These tools tell us about trends, but they do not help us understand the character of a the trend. Is the trend weak, or strong, or stable, or volatile? The Guppy Multiple Moving Average indicator helpd to understand this character of the trend because it captures the changing differences between price and value.

A crossover delivers two messages about the market. The first, and most commonly understood, is a message about price. Today’s price is higher, or lower, than the average price over two time frames.

The second message is about value. At the moment in time when the two averages crossover there is a fleeting agreement about the value of the stock.  Price is what we pay for a stock and value is what we think the stock is worth.

Generally we try to get stock at a price that is below what we believe is its true value. Changes in value drives the market. As soon as there is agreement about value, then we can expect disagreement. It is human nature.

Imagine a popular newsletter recommended stock XYX as an excellent, sure fire, cannot fail, buy at $1.50. The market is closed and the last traded price for XYX was $1.50. If you wanted to buy XYX tomorrow on the open, would you bid $1.50 knowing that many other people had also read the same newsletter?

With such widespread agreement on value from the people who read the newsletter, you need to bid $1.52 just to get ahead of the crowd. Other readers bid even higher, just to be sure of getting stock. Still others will watch the open of the market, perhaps at $1.55, and then bid ahead of the market at $1.58 to get the stock.

The key  point is that where there is agreement in the market about value, it is usually followed by disagreement.

We see this in action when we take a group of moving averages. We assemble a group of 3, 5, 8, 10, 12, and 15 day exponential moving averages to track this short term traders  think. We cannot know for certain that these are short term traders, but it   provides a guide to short term movements in the market. It is convenient to think of these as representing traders.

 Guppy multiple moving average chart

The chart shows two characteristics. When there is widespread agreement amongst traders about value - when the averages all converge – it is often followed by an explosive move as the moving averages start to move apart. Traders outbid each other to get hold of stock.

This is the second characteristic of the chart display. When the averages are very wide spread - when people get too carried away about the price of a stock when compared to value - the price collapses. This type of chart shows bubbles of short term excitement.

The market is driven by two groups – traders and investors. Investor activity provides stability in a trend so if we can understand their behaviour we can make a better decision about the strength of the trend.

 Guppy multiple moving average chart

We track the inferred behaviour of investors  using a group of 30, 35, 40, 45, 50 and 60 day exponential moving averages. We see the same pattern with this group.

Think of these as six fund managers. They all decide the stock is worth adding to their portfolio. The only way they can get stock is to outbid their competitors. Because they often want very large blocks of stock, they have no choice but to pay a bit more than the current market price.

To put their analysis into action they have to buy stock on the open market and beat their competitors. The common agreement on value is shattered when they start buying stock. Just like traders, when investors agree about value, it is followed by a disagreement about value. And, at the point of maximum disagreement, the price collapses. Their activity is a fractal repetition of the activity of the traders.

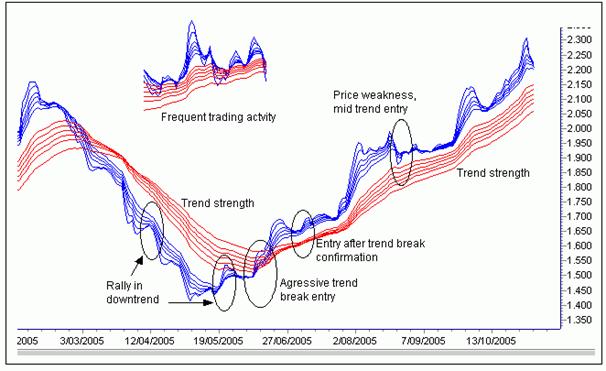
As the chart shows, when we track the implied activity of both groups - traders and investors - the Guppy Multiple Moving Average indicator is particularly useful for identifying major shifts in the trend. When both groups converge and agree about value, then this is a signal for a very major change or acceleration in the trend. When only one group gets carried away - usually the traders - we know how much impact they are likely to have because the Guppy Multiple Moving Average shows us where the long term agreement of values lies.

In more advanced application of the Guppy Multiple Moving Average the relationship between each of the groups is used to help determine the type of trading opportunity. It is also used to evaluate the potential for a trend break to succeed. These aspects assist traders in making better decisions about the best trading approach to use with each opportunity.

This powerful tool helps traders to understand the mood of the market. Unlike just two moving averages, what is important is not the price reading, but the relationship between the way the two groups value the stock in the current market.


Trading Signals
Convergence and Divergence:
  • When moving averages within a group are parallel and close together, the group are largely in agreement;
  • When the moving averages widen, this signals divergent views within the group;
  • When moving averages converge, this is a sign that the group view is changing.

Trend strength:

  • Parallel long-term MAs signal long-term investor support and a strong trend; and
  • Short-term MAs tend to bounce off the long-term moving average group.

Trend weakness:

  • Both groups of  MAs converge and fluctuate more than usual.

Trend start:

  • A change in price direction accompanied by expanding MAs in both groups.

Short-term reversals:

  • The short-term group diverge after crossing over before again converging.

Crossovers are not as important as spacing between the MAs in each group.


Example of Trend line Breaks

The Guppy Multiple Moving Average (GMMA) indicator tool is based on the relationships between groups of moving averages. Each group of averages in the GMMA provides insight into the behavior of the two dominant groups in the market - traders and investors. The indicator allows the trader to understand the market relationships shown in the chart and so select the most appropriate trading methodology and the best tools. The GMMA is designed to understand the nature of trend activity on an end of day, or intraday basis.

The inferred activity of traders is tracked by using a group of short term moving averages. The traders always lead the change in trend. Their buying pushes up prices in anticipation of a trend change. Their activity is shown by a 3, 5, 8, 10, 12 and 15 day group of exponentially calculated moving averages.

The trend survives only if other buyers also come into the market. Strong trends are supported by long term investors. The investor takes more time to recognize the change in a trend but he always follows the lead set by traders. We track the investors' inferred activity by using a group of long term moving averages. This group is 30, 35, 40, 45, 50 and 60 day exponentially calculated moving averages.

The GMMA is used in six trading situations

  • Classic trend breaks
  • Join the trend
  • Using price weakness
  • Rally and trend break
  • Better exits
  • Bubble trading

In these notes we look at just one of these applications.

CLASSIC TREND BREAKS

The chart shows the classic application of the GMMA. We start with the breakout above the straight edge trend line. The vertical line shows the decision point on the day of the breakout. We need to be sure this breakout is for real and likely to continue upwards. After several months in a downtrend the initial breakout sometimes fails and develops as shown by the thick black line.

The GMMA is used to assess the probability the trend break shown by the straight edge trend line is genuine. We start by observing the activity of the short term group. This tells us what traders are thinking. In area A we see a compression of the averages. This suggests traders have reached an agreement on price and value. The only way to take advantage of this 'cheap' price is to buy stock. Unfortunately many other short term traders have reached the same conclusion. Traders who believe they are missing out on the opportunity outbid their competitors to ensure they get a position in the stock at favourable prices.

The compression of these averages shows agreement about price and value. The expansion of the group shows traders are excited about future prospects of increased value even though prices are still rising. These traders buy in anticipation of a trend change. They are probing for a trend change. We want confirmation the long term investors are also buying this confidence.

The long term group of averages at the decision point show signs of compression and the beginning of a change in direction. Notice how quickly the compression starts and the decisive change in direction. This is despite the longest average of 60 days which we would normally expect to lag well behind any trend change. This compression and change in direction tells us there is an increased probability the change in trend direction is for real and sustainable. This encourages us to buy the stock soon after the decision point shown.

This compression and eventual crossover within the long term group takes place in area B. The trend change is confirmed. The agreement amongst investors about price and value cannot last because where there is agreement some people see opportunity. Many investors missed out on joining the trend change prior to area B and now the change is confirmed, they want to get part of the action. Generally investors move larger funds than traders so their activity in the market has a larger impact.

The latecomers can only buy stock if they outbid their competitors. The stronger the initial trend, the more pressure to get an early position. This increased bidding supports the trend and is shown by the way the long term group continues to move up, and by the way the long term group of averages separates. The wider the spread the more powerful the underlying trend.

Even traders retain faith in this trend change. The sell-off in area C is not very strong. The group of short term averages dips towards the long term group and then bounces away quickly. The long term group of averages shows investors take this opportunity to buy stock at temporarily weakened prices. Although the long term group falters at this point, the degree of separation remains relatively constant, confirming the strength of the emerging trend.

The GMMA identifies a significant change in the market's opinion about the stock. The compression of the short term and long term groups validates the trend break signal generated by a close above the straight edge trend line. Using this basic application of the GMMA, the trader has the confidence necessary to buy at, or just after the decision points shown on the chart extract. The GMMA allows the trader to understand the nature and character of the trend. Armed with this knowledge we select the most effective trading tools for each situation.

 
Application of The Guppy Multiple Moving Average
 

This Guppy Multiple Moving Average (GMMA) indicator tool is based on the relationships between groups of moving averages. Each group of averages in the GMMA provides insight into the behaviour of the two dominant groups in the market – traders and investors.

The indicator itself does not initiate an entry or an exit.  It allows the trader to understand the market relationships shown in the chart and so select the most appropriate trading methodology and the best tools.

The GMMA is designed to understand the nature of trend activity. If there is no trend, then the tool cannot be usefully applied. Traders should not attempt to make it work in conditions to which it is unsuited.

We track the trader’s inferred activity by using a group of short term moving averages. The traders always lead the change in trend. Their buying pushes up prices in anticipation of a trend change. The trend survives only if other buyers also come into the market. Strong trends are supported by long term investors.

The investor takes more time to recognize the change in a trend but he always follows the lead set by traders. We track the investors’ inferred activity by using a group of long term moving averages.  

The GMMA is used in six trading situations.  In this extract we are interested in mid trend entry conditions.

Mid trend Entry

The mid trend entry analysis is designed to answer a simple question. Is it safe to buy on this temporary price retreat?

The circled area on the chart shows the point where we want to apply the analysis.

There are three relationships we look for.

They are:
1.    The character of the long term group.
2.    The character of the short term group
3.    The relationship between the two groups.
 

The long term group is the most important because without support from investors, the trend cannot continue. The strength of this support is shown by the degree and nature of the separation of averages in the long term group. When the group is well separated, and generally moving upwards and parallel, we know the trend is very strong. This reduces the probability of a sudden trend collapse.


The short term group of averages – the traders - deliver a consistent pattern of retreat and rebounds. We need to decide  if the current retreat is unusual, out of character, or severe. In this example it is part of an established pattern of general retreats and rebounds. This is not a dramatic sell off, so there is again a reduced probability of a trend collapse.

Finally consider the separation between the two groups. This trend, at the point circled, has never been under threat. Traders have not been successful in driving prices down. Instead as prices dip, investors step into the market as buyers. This is shown by the way the two groups of averages remain separated even on these trader driven retreats.

This is a strong trend with a temporary price retreat. It is a safe entry.