Lets call them GMMA trend failures.
By using GMMA analysis traders are able determine whether a trend is strong and reliable.
We are able to identify breakouts that are developing into a new trade, and we are able to determine whether a price retreat is simply a buying opportunity. The GMMA also helps traders to recognise trend weakness and trend failure.
There are several key indicators that traders look for. Just as wide separation of the GMMA lines is a sign of good trend strength the compression of these lines is a sign of weakness.
There are three sets of relationships that traders need to observe when looking for weakness in the GMMA.
1) The relationship between the short term group of lines. On an end of day chart this group represents the short term position traders. As these lines compress it shows that the traders are taking profits and getting out of the stock. As long as the long term GMMA group remains separated a compression of the short term group and subsequent price retreat can represent a buying opportunity.
2) Compression in the long term group shows that investors have lost faith in the stock and are also selling. The long term group is the key to trend strength, as long as the long term GMMA lines remain widely separated there is little chance of the trend ending as the long term investors will buy any stock the short term traders sell. Compression in the long term group is the largest sign of trend weakness.
3) The relationship between the two groups of moving averages. If the two groups are well separated this is an additional sign of trend strength, but if there is not much room between the short term and long term group traders take this as a warning sign. When the short term group starts to bounce along the top of the long term traders need to be particularly careful and may tighten their stops and when the short term group begins to penetrate the long term group this is a sign for traders to start closing their positions. If the short term group fully enter the long term group this is the signal of a trend change.
Lets look at an example
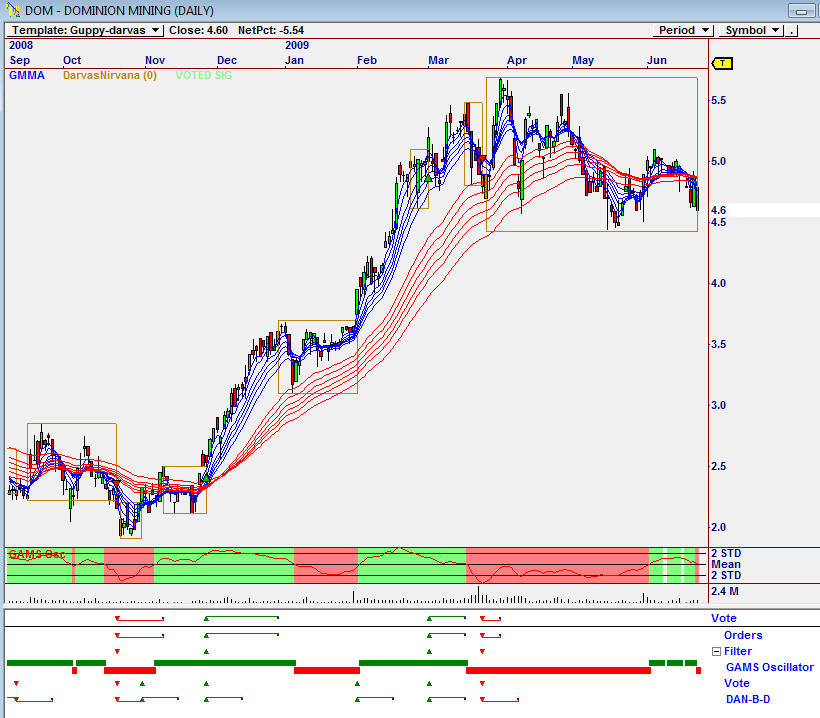
Dominion Mining (DOM) has been in a solid uptrend since late November 08 after a GMMA breakout rising from $2.35 to a high of around $5.70 but started to run into trouble in mid March.
Holding DOM from the end of November 2008 to mid March 2009 would have been profitable. OmniTrader would have signalled opportunities to buy and to go short during this period.
The first warning sign that DOM was in trouble was the price pullback where price (blue lines) entered the long term GMMA (red lines) in mid March. Looking at the GMMA we can see that the long term GMMA group (red lines) was still well separated showing trend strength but we can see that as price came back the long term group did begin to turn slightly, especially along the 30 day moving average (top red line) of the long term GMMA group.
Price pullback that doesn’t drastically effect the long term group is a sign of price weakness and not trend weakness, therefore becomes a buying opportunity. But if price enters the long term GMMA group this a sign of weakness and a warning signal for traders. This is what happened in April and May.

Earlier in the DOM trend we can see that price entered the long term GMMA group in January 2009, and even though the long term group continued to remain strong traders will observe there is high compression in the short term group during January. This tells us that traders were heavily selling DOM and it was not until February that we saw confidence return to the short term GMMA group.
After the initial March 2009 pullback there are numerous warning signs for traders to pick up on showing the end of this trend was approaching.
1) Price rallies and falls back into the long term GMMA group for a second time (start of April) and rarely leaves the long term group after this.
2) From April there is high compression in the short term GMMA group as it bounces along the top of the long term GMMA group, touching twice before the short term group finally penetrate the long term group in May and a trend change is confirmed
3) That during the period of time where the short term group was bouncing across the top of the long term group, the long term group was beginning to compress. The gradient of the lines became more shallow and with each new penetration of price into the long term group the fluctuations became greater. This was a loud and clear signal that this trend was nearing an end.