
|
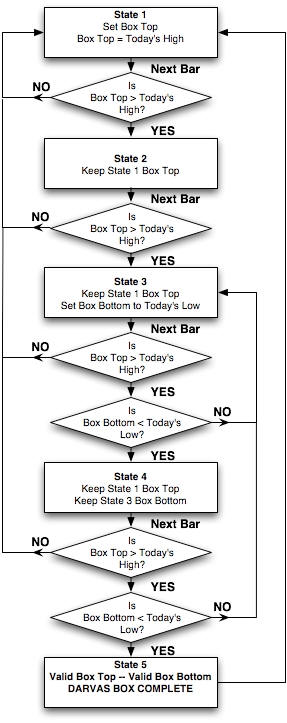
The Classic Darvas Box uses the High First Method of Construction, meaning it will calculate the top of the box first and then establish the bottom of the box. This method can be represented using a condition based flowchart in which processing moves from one state to the next once certain conditions are met.
To construct a Darvas Box, we are going to spend at least three bars finding and validating the top of a box (States #1, #2 and #3), and we are going to spend at least three bars finding and validating the bottom of a box (States #3, #4 and #5). Once we have reached State #5, we have a valid Box Top and a valid Box Bottom �a Darvas Box.
On day one, we start off in State #1. This state tells us to set the Box Top to today's high. There is only one State per bar.
From State #1, we proceed to the next bar. If the Box Top that was saved from State #1 (yesterday) is less than today's high, we go back to State #1 and start over by setting the Box Top to today's high (a new Box Top). If the Box Top that was saved from State #1 is greater than today's high, we proceed to State #2, keeping the Box Top from yesterday.
From State #2
, we proceed to the next bar. If the Box Top that was saved from State #1 (two days ago) is less than today's high, we go back to State #1, and set the Box Top to today's high (a new Box Top).If the Box Top that was saved from State #1 is greater than today's high, we proceed to State #3, keeping the Box Top from two bars ago. Having reached State #3, we also begin construction of our Box Bottom by setting the Box Bottom to today�s low.
At this point, we have temporarily defined the Box Top and begun construction on the Box Bottom. Having reached this point in the construction process (State #3), we must now look not only at the Box Top, but Box Bottom as we proceed forward. 3
From State #3
, we proceed to the next bar. If the Box Top that we saved from bars past is less than today's high, construction has ended and we go all the way back to State #1, setting the Box Top to today�s high (a new Box Top). If the Box Top we saved from days past is still greater than today's high, we now proceed to the second part of the decision process which involves looking at the Box Bottom and low prices.If the current bar low is lower than the saved Box Bottom (State #3), go back to State #3, and set the Box Bottom to today's low. If on the other hand, the current bar low is higher than the saved Box Bottom (State #3), we proceed to State #4, keeping both the Box Top and Box Bottom from State #3.
State #4 is similar to State #3, in that both the Box Top and the Box Bottom are considered in the decision making process.
From State #4
, we proceed to the next bar. If today's high is greater than the Box Top we saved in State #4, construction has ended and we go all the way back to State #1, setting the Box Top to today�s high (a new Box Top). On the other hand, if the Box Top we saved in State #4 is still greater than today's high, we now proceed to the second part of the decision process which involves the Box Bottom and low prices.If the Box Bottom that we saved in State #4 is higher than the current bars low, we go back to State #3 and set the Box Bottom to the current days bars low. If on the other hand, the Box Bottom that we saved in State #4 is still lower than the current bars low, we go to State #5.
Once we are in State #5
, we have a valid Box Top and a valid Box Bottom � a Darvas Box.Now that we have a Darvas Box, we simply wait until we get a day's high selling price that is greater than the Box Top (a long signal) or a day's low selling price that is lower than the Box Bottom (a short signal).
A flowchart illustrating the construction of a classic Darvas Box is shown on the following page
|
Darvas
applies a filter to price movements to help determine which
price moves are significant, and which are not. The filter is
established by upper and lower limits of a Darvas box.
The top of the Darvas box always starts with a
new high. This high must be followed by 3 days that
are lower. The bottom of the Darvas box
can only be calculated after the top of the Darvas
box has been confirmed. It is constructed in the opposite
way to the top of the box. It uses as its starting point the
lowest low that occurs AFTER the top of the Darvas box is
established. It is again a 4 day pattern, but it
starts 1 day after the top of the box pattern. This
means it takes a minimum of 5 days for a Darvas box to be
identified for both top and bottom. |
PLOTTING THE DARVAS BOX By Daryl Guppy
The search for a valid Darvas box starts with a new high for the selected period. Darvas used a new twelve month high. This is a good tactic for a strong and established bull market and has a good level of reliability. Our research puts this at around the 80% level. In modern markets we have found that using a new high for the six month period also return good results with an acceptable level of reliability. This is still around 70% and puts this technique in the select group of trend approaches which are very successful.
Very aggressive applications of this technique use a new high for a three month period. We find this a less successful application, with reliability shrinking to between 50% and 60%. In strong bear markets it is likely that the failure rate will be much higher as there are generally many more false breakouts in these conditions. Our research suggests that the early application of the Darvas technique to these bear market breakouts has a reduced level of reliability. It is a technique that can be used to capture early breakouts and developing trends, but there are many other techniques which are more effective for trading in these conditions.
SETTING THE TOP
When applying this technique traders start with a new high for the selected period. This has the capacity to set the top of the D_Box if the correct conditions are established by subsequent price action.
Setting the top of the box takes a minimum of four days of price action. It never takes any longer. The high must be followed by three days of lower highs. This does not mean the highs are all descending highs where each one is lower than the previous high. The deciding factor is that the three highs must all be lower than the initial high � bar 1 � that triggered the start of the pattern. In the example shown the first three days show a pattern of descending bars, but the last day in the extract has a high that is higher than the previous days� bar. This is acceptable because the three most recent bars have highs that are all lower than bar 1.
This is always a four day pattern. If one of the three days after bar 1 sets an equal high the calculation is abandoned. The new, most recent equal high, is used as a new starting point. Alternatively, if one of the three days after bar 1 sets a high that is higher than bar 1, the current D_Box construction is abandoned and the new highest high for the period is used as a starting point for plotting a new D_Box.
The objective is to capture the high for the period and then plot the bullish strength over the next three days. No move is made to start calculating the bottom of the Darvas box until the top of the box is confirmed. Once the top is verified our attention shifts to plotting the correct placement of the bottom of the box.
SETTING THE BOTTOM
The bottom of the D_Box is designed to define the limits of bearish strength. When the box is completed it captures the bullish and bearish range of prices. This makes breakouts above or below the box limits particularly significant and this underlies the trend following and stop loss strategies of the technique.
As soon as the top of the box is confirmed the trader looks for the most recent low that has occurred after and including bar 1. In most cases the lowest bar will be below the low of bar 1 as shown in this example. The lowest bar is used as the start of the calculation point for setting the bottom of the Darvas box. It is set when the bar is followed by three days of higher lows. The starting point of the calculation captures the limits of bearish strength. After this low the bulls take charge and prices lift steadily.
We do not look for three consecutively higher lows where each low is higher than the low of the previous day. The defining feature is that the subsequent lows might be higher than the low of the bar used for the starting point of the calculation. In the example shown, the three bars have lows that are higher than bar A. The low of the last bar in the series is lower than the low of the previous day. This is OK because the lows of the days following bar A are all higher than the low of bar A.
We have used this example because it shows that once the top of the box is set it may take a few more days before the conditions occur which are necessary to set the bottom of the box. Once the top of the box is set the bottom of the box does not automatically start from the most recent low, ignoring any further lows.
The bottom of the box is only set once the specified conditions have been met. If a new equal low appears within three days after bar A, the current calculation is abandoned and a new calculation starts from the new and most recent equal low.
SPECIAL CASE
Darvas recognized one special and unusual case. When the technique was first developed the market had a different volatility profile. It was unusual for the starting bar of the calculation � bar 1 � to form both the high of the box and the low of the box. Darvas developed a special rule to deal with this exception. In modern markets we see more examples of this exception. The construction of the box proceeds in the normal fashion, but setting the bottom of the box is slightly different.
We start with a new high for the selected period. We look for three days of lower highs as shown. The top of the box is plotted. As soon as the top of the box is in place we start looking for the lowest low of the period starting with and INCLUDING the low created by bar 1.
In the example shown bar 1 also has the capacity to become bar A and set the bottom of the Darvas box. The conditions we look for are three days of high lows. We have used an extreme example here. In this case the first three days of lower highs also show three days of higher lows. Once the top of the D_Box is set and the trader turns to the most recent low he finds that bar 1 is also the lowest low for the period. In this case the following three days also show a pattern of lows that are higher than the low of bar 1/A. In this extreme example the top and the bottom of the box are set simultaneously.
It is not uncommon in today�s volatile markets for the initiating bar � bar 1 � to also act as the confirming bar for the bottom of the D_Box � bar A. What was an exceptional case at the time Darvas was trading is now much less unusual.
BOX LIMITS AND TRIGGERS
What happens after the top and the bottom of the box have been set is at the core of the application of the Darvas strategy. Once set, the perimeter of the box does not change until there is a break above or below the bottom of the box. The perimeter sets a trigger level for action. The placement or validity of the box is not effected by days that set lows equal to the bottom of the box, as shown by bar X or by days with highs equal to the top of the box as shown by bar Y.
Once the perimeter of the box have been set they remain in place. New equal highs are only important if they appear BEFORE the top of the box is set and validated. Same with the bottom of the box. New equal lows are only important if they appear BEFORE the bottom of the box is confirmed.
The situation shown in the chart example does not call for the setting of a new D_Box. They are potential signals for a breakout as both the bulls and the bears test the limits of their previous range.
The triggers for action using the Darvas technique are set by price moves above the top of the box, or below the bottom of the box. A price move above the top of the box is a signal for entry action using the classic Darvas approach. Again, because of modern volatility, we find the reliability of the method is improved if we wait for a close above the top of the D_Box.
Two important things happen once we have a price move above the top of the box. The first is that the bottom of the box is immediately used as a stop loss level for the new trade. Aggressive traders act in anticipation of a D_Box breakout. They buy stock once the bottom of the box has been confirmed. They buy in anticipation of a breakout above the top of the D_Box. In this case they also use the bottom of the D_Box as a stop loss point.
The breakout above the top of the D_Box, by definition, sets a new high for the selected period. Traders immediately start to apply the conditions necessary to set a new D_Box. Once the new high is followed by three lower highs the top of a potential new D_Box is established. Once the bottom of the new D_Box is created the stop loss level is lifted to match the new D_Box. This is the essence of Darvas trade management.
The final D_Box configuration is a D_Box failure. This is signaled when prices close below the bottom of the D_Box. This is always a possibility. In an open trade, this close is a signal to exit as it suggests that the prevailing up trend has come to an end. The classic application of the technique signals an exit as soon as there is a price move below this level. Our preference is to use a close below this level as a signal.
Once the D_Box is established there is no guarantee that prices will provide an entry signal by closing above the top of the box. Some prices just continue to drift lower. Once they break below the bottom of the D_Box the trade is closed, or the potential trade is abandoned. No new action is taken until this stock is able to make a new high for the selected period. Once this occurs the trader will start to apply D_Box construction techniques again.
The Darvas trading technique is easy to apply. It provides a useful way to identify trends and to trade breakouts to new highs with a high level of confidence that the high is not a blow off top, but part of a strong bullish trend.