The average true range (ATR) indicator was developed by Welles Wilder. It is a measure of the true ranging activity of a stock. Most times when we talk about range we mean the difference between the high and the low for the day. This gives us an idea of how volatile the stock is. This measurement does not tell us who is in charge of the price bulls or bears.
The ATR indicator measures only the range of prices set by the strongest players in the markets. It does this by comparing the distance from yesterdays close to todays high, and the distance from yesterdays close to todays low. This is combined with the distance from todays high and low. These figures are averaged to give the Average True Range of price movements between the end of yesterdays trade and the close of todays trading.
TRADERS ATR
The traders application of the Average True Range (ATR) captures price volatility, defines the emerging trend breakout and provides a method to manage the developing trade. Our purpose is to use the ATR calculation as a stop loss designed to protect capital and identify the end of one trend and the beginning of another. We use the ATR as a method to identify and confirm trend changes. Later we want to use the ATR as a protect profit stop deigned to protect profits and identify the end of a trend.
The traders ATR takes the calculation results and displays them in a way that is useful for trading decisions. It has five elements.
1. We start with the result of the ATR calculation and create a ratchet or stepped process. For example, we start with the first ATR calculation of 1.00. If tomorrows ATR calculation is 1.2 then the value of the ATR is plotted at a higher level. If the following days ATR calculation falls back to 1.00 then the new lower ATR value is ignored. The ATR value is shown as the previous days ATR value of 1.02. Values lower than 1.02 are ignored until a new higher ATR value is calculated. This process is shown below. The dots show the value of the ATR calculation. The three dots below the horizontal ATR line show ATR values lower than the value of the horizontal ATR line.
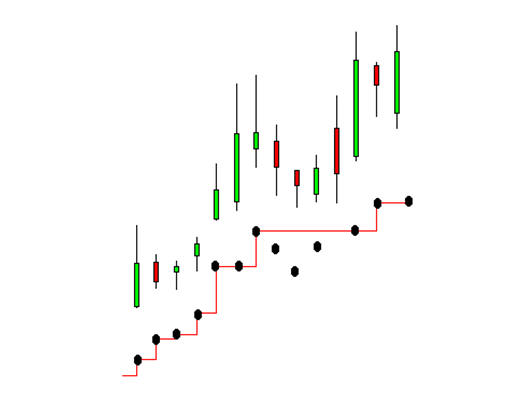
When the next ATR value is 1.03 then the ATR plot moves higher. Using this first modification the ATR value follows the rising trend without taking any backward steps. This makes the ATR more useful as a stop loss method rather than just an interesting measure of all changes in price volatility.
In a falling trend the same principle is applied, but in reverse. The ATR in a falling trend is designed to follow falling prices down. In this environment the ATR shows only lower ATR values and ignores any higher ATR values.
2. The second element of the trader ATR is the relationship between the ATR calculation and the current price. How is the ATR value of 1.00 related to todays price? Unless the trader establishes a relationship then the ATR calculation remains a curiosity rather than a trading tool.
We start with a long side trade. Here the intention to enter an uptrend and use the ATR as a method of managing the trend. A fall that is greater than the value of the ATR suggests the price volatility has expanded. This is a potential end of trend signal. To use the ATR in this way the value of the ATR must be directly related to the current price so it establishes a barrier. If the price tomorrow moves below the value of todays ATR then it creates a trading signal.
The purpose in using the ATR is to create a stop loss line that follows a rising trend and gives an exit signal when there is increased probability the trend is changing. Our preference is to subtract the value of the ATR from the value of the close to establish the correct position of the ATR exit signal. This selection is a solution to the increased volatility in the market.
3. There is a third element in the calculation of the ATR is the length of the average calculation. Depending on the software you use, the default is a 14 day or 10 day average period for the calculation. In conditions of higher price volatility a 7 day average calculation is more suitable for catching rallies and extended fast moving short term trends.
4. The fourth element in the ATR calculation is the multiplication factor. The multiplication factor is applied to the value of the ATR calculation. If the value of the 7 day ATR calculation is 1.00 then the 1*ATR value is also 1.00. The value of the 2*ATR would be 2.00. This can be extended to a 3*ATR equalling 3.00 but this is not useful for either investing or trading solutions.
The selection of the ATR multiplication value has a significant impact on the management of the trade. The 2*ATR captures the long term underlying trend. The 1*ATR calculation is more sensitive, and triggers an earlier, and potentially, false exist.
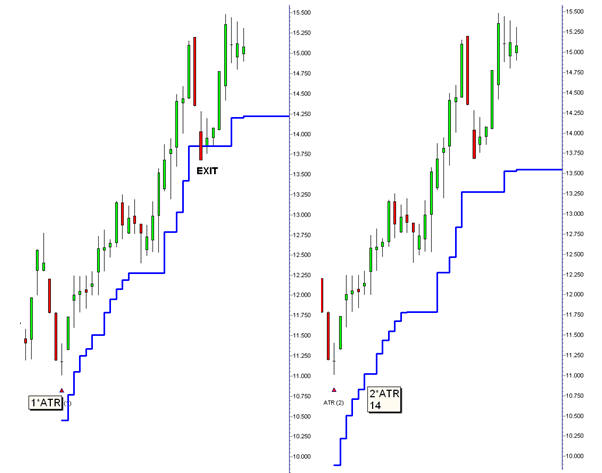
We prefer to use the 1*ATR. Its a trade-off between more frequent exit signals and collecting better profits. The 1*ATR generates a false exit signal while the 2*ATR keeps the trader in the trade. However, if the 2*ATR exit signal had been triggered then the profit erosion for this trade is substantially larger than the profit erosion using the 1*ATR. Using the trend high at $15.80 as the calculation point, traders profits are eroded 13 % with the 2*ATR signal compared to a 9% profit erosion using the 1*ATR signal.
5. The fifth element is the ATR display on the chart. It is this display that creates the full application of the traders ATR. In a rising trend the ATR values only move up. The value of the ATR is shown with a continuous stepped line. This display is available as a default indicator in the Guppy Traders Essentials charting package. When the price closes below the ATR line an exit signal is created. The ATR line is extended to the right clearly showing an end of trend signal. The stepped line display provides the trader with an instant evaluation of the current price in relation to the ATR stop loss conditions. This is the traders application of the ATR, and it opens the door to two other trading applications. SLIDING ATR
When the traders ATR is displayed on a chart it provides a clear and elegant solution for managing the trend. However the value of the ATR is often well below the current price activity.
The count back line indicator follows the downtrend and gives an entry signal when price closes above the value of the CBL line in a down trend. This signals a change in the volatility of price in the existing downtrend and points the way to a higher probability of trend reversal.
This same logic is applied with the ATR. The downtrend is followed using the short-side calculation for the ATR. The ATR line continues to fall until there is a closing price higher than the value of the short side ATR. This is a signal to close short positions and the closing value of the ATR provides a reverence point for a potential new uptrend. This is not an automatic stop and reverse process. A close above the short-side ATR is a signal the short trade is closed. It is not a signal to open a long side trade.
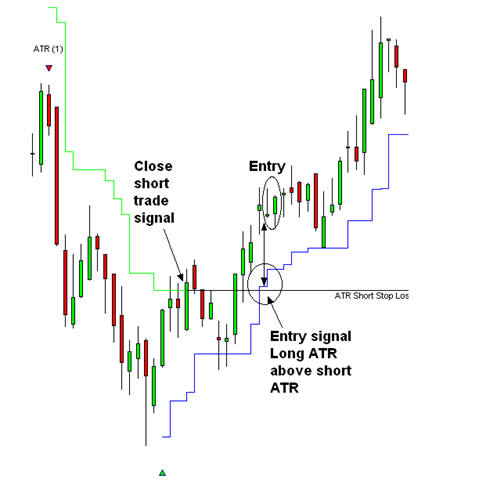
As shown traders start a long side ATR calculation. The entry signal is generated when the value of the long side ATR is higher than the closing value of the short side ATR. This is area A on the chart extract.
The down trend is defined with the 1*ATR short side trading indicator. This is a 1*ATR calculation using a 7 day moving average period. It is used to define long term down trends. Traders wait for the price to move above the 1*ATR short side line. The entry signal is when the 1*ATR long side trading indicator value is very near to, or above the value of the 1*ATR short side indicator value. The objective is to enter the trade when the price rebound from near the value of the 1*ATR long side line. The price sometimes dips below the ATR line but closes above the ATR line and develops up momentum on the next day. This is an entry opportunity.
Waiting for this condition increases the probability the trend change is genuine. Traders can apply a sliding ATR entry technique or join the trade at the best possible price in the days following the trend breakout confirmation.
The expansion in price volatility is the defining feature of the post-GFC market. The management of extended short term rallies and declines provides the solution to consistent profits. The use of the traders application of the ATR provides an effective solution for end of day trading in stocks, indexes, commodities and currencies. The same method is also applied to intraday trading using 3, 5 and 15 minute charts.
The traders ATR is defined as a trading solution. It is not applied as a long term investment or trend following solution, although higher values such as 2*ATR can be used in this way.
TACTICS
ñ In long side trading buy while the price is above the ATR value.
ñ Sell when price drops below the ATR value
ñ In short side trading buy while price is below the ATR value
ñ Sell when price rises above the ATR value.
ñ Exits can be executed on either intraday alerts or at the open on the following day.
RULES
ñ The ATR value defines the acceptable limits of volatility.
ñ A move beyond these ATR limits signals an end to the current trend.
ñ Stop loss is based on the value of the ATR. This is updated whenever necessary
ñ
ADVANTAGES
ñ A good measure of volatility.
ñ Good for short term trends
ñ Good for momentum driven trading as a stop loss and protect profit method
ñ Very useful for intra-day trading.
ñ Works well with derivatives.