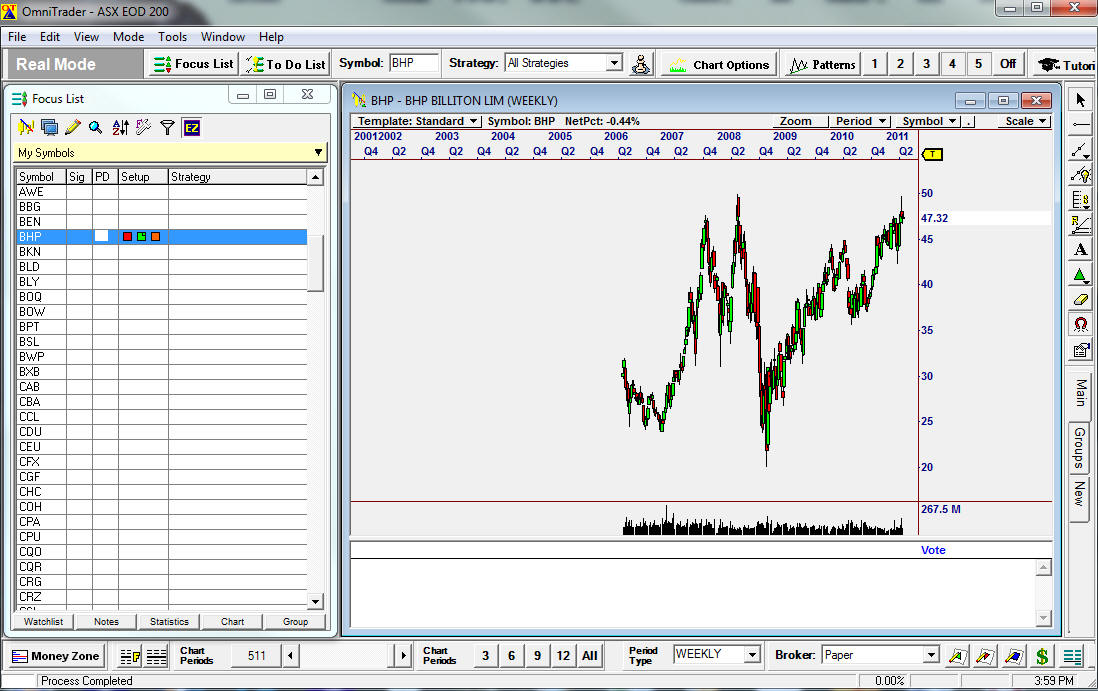
The following is a typical chart with a focus list and nothing seems activated, no signals in the focus list or chart and not enough data
| Viewing More Data in the Charts |
| The default display in a chart is often only a few years. If you want to view up to say 10 years of data, then a few changes are need. |
|
The following is a typical chart with a focus list and nothing seems activated, no signals in the focus list or chart and not enough data |
|
|
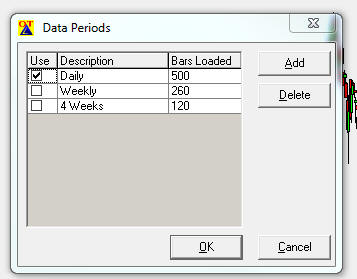
| The problem is that the Data periods need to be increased and to get signals you need to place a tick in the box |
|
|
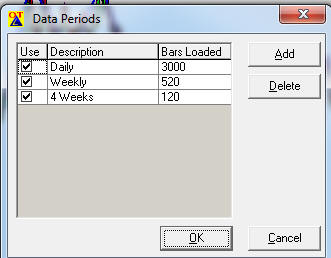
| Here is the data period option set up for 10 years |
|
|
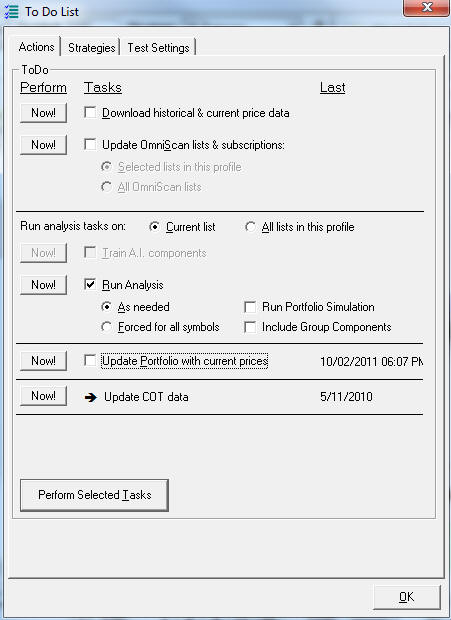
| To get signals to activate you need to run the TO DO option each time you load in new price data, hit the Perform Selected Tasks button |
|
|
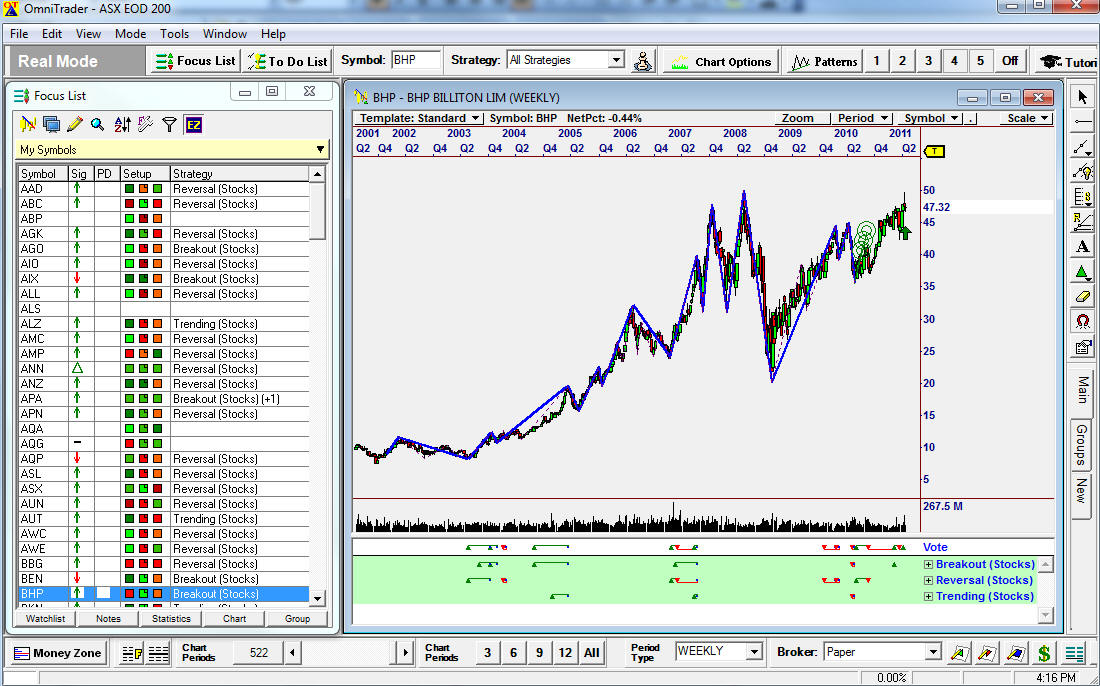
| Here is the final analysis when the chart periods are set to WEEKLY (as an example) - other options are daily or 4 weekly |
|
|