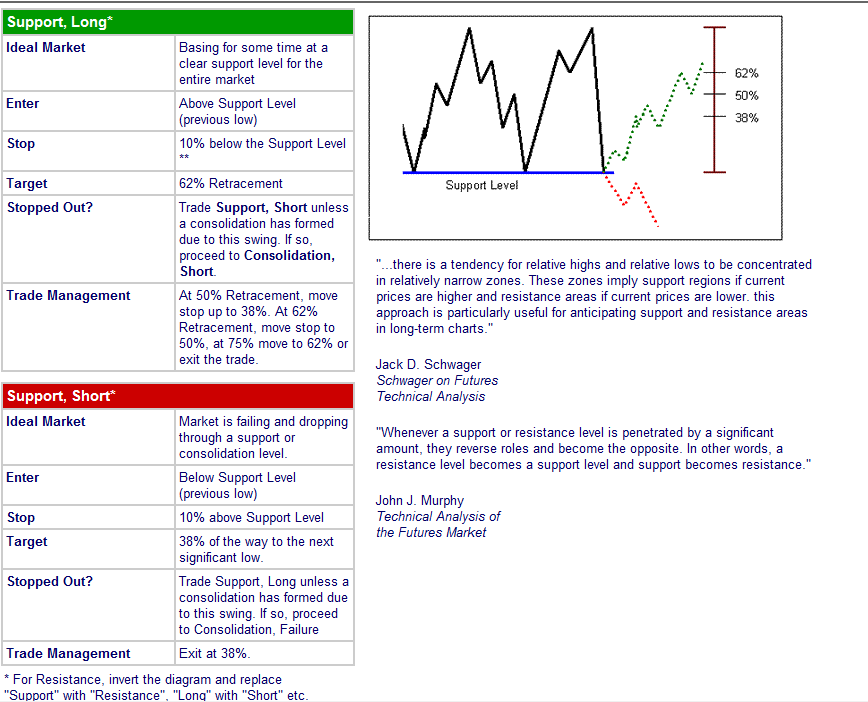
History Tells Us When Securities are Overbought or OversoldSupport indicates a level on the chart where we can expect an increase in the demand for a security (buyers take over). How do we know this? By identifying this reaction to a price level in the chart's history. If we look at most charts, we see that there are certain levels where selling pressure subsides and the trend will shift as price increases. When this happens, we can assume that this level will retain its significance when price approaches it again. This is known as support, as the securities price is supported at this level. Conversely, resistance is the level where the securities price has shown an inability to rise anymore, and a reversal to the downside can be expected. As we see price approach these levels, we can usually expect a reversal in trend. However, what if price exceeds these levels? This is still a tradable situation. A break of these levels mean that current market conditions have pushed price beyond a historical reversal point, and a continuation of the current trend can be expected. Also, it is important to remember that when one of these levels is broken, they will often "change roles" and behave as their counterpart. For example, if price sufficiently moves through a support level, this level still has significance and it should now be viewed as a resistance level. Practice identifying support and resistance levels when you are looking at charts. They are easy spot, easy to understand, and paramount when making trading decisions. |

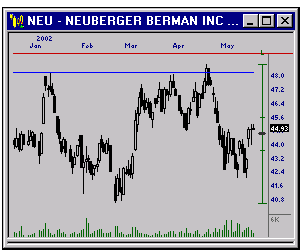
48 is clearly a Resistance Level for NEU

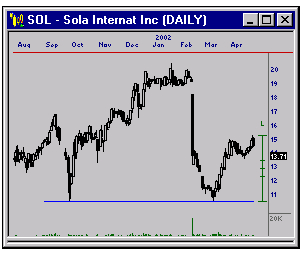
SOL shows solid Support at 10.5

The Support break by FON means that 19 should be viewed
as potential Resistance in the future
|
