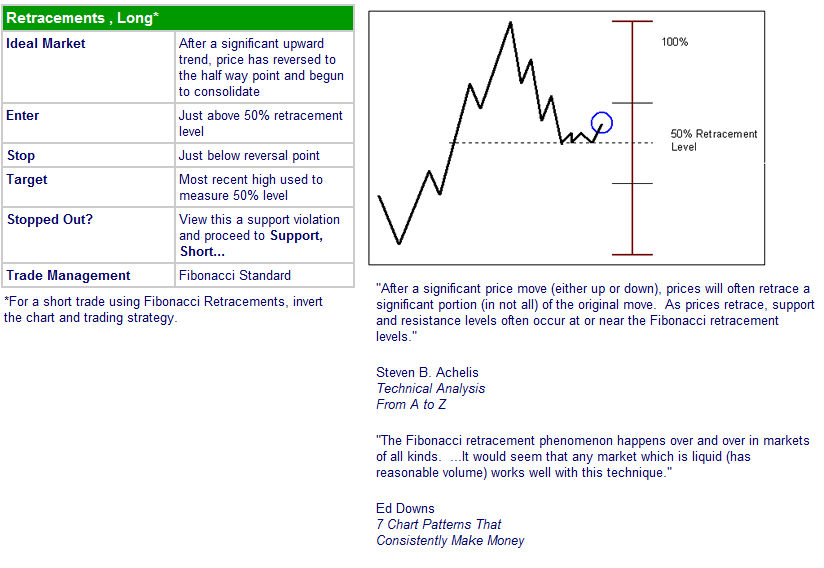
Using Retracement Levels in Your TradingLeonardo Fibonacci da Pisa was a thirteenth century mathematician who (re) discovered what is today known as the Fibonacci sequence. Adding 1+1 and then continuing to add the sum to the previous number will arrive at this numerical sequence. The sequence gives rise to the following numbers: 1, 1, 2, 3, 5, 8, 13, 21, 34, 55 and so on. Ratios of these numbers to each other give us important values: 62%, 50% and 38%. The prevalence of these ratios can be found all around us - from the double helix of DNA to spiral galaxies! The pioneering work of traders like W.D. Gann and R.N Elliott also showed that these ratios are prevalent in the financial markets. While there are many uses for these ratios in technical analysis, we are going to concentrate today on Fibonacci Retracement Levels. Many technicians have noted that markets tend to reverse or consolidate once they reach one of these ratio levels (measured from the distance of the previous trends reversal). They can used as entry levels, exit levels and even as a money management tool (as in OmniTrader's Eighth Tool). To identify Fibonacci Retracement Levels, you must first identify the latest peak and valley in the securities chart. Once this is done, you can measure 3/8ths, 4/8ths and 5/8ths of the distance from valley to peak (or vice versa if you are looking at a short position). In OmniTrader, there two tools that help you do this. The Fibonacci Retracement Tool will try and identify the latest peaks and valleys and then show you where these important levels are located. The Eight's Tool in OmniTrader allows you to draw across the latest peaks and valleys yourself and then see how that trend divides into eighths. Fibonacci Retracement Levels are one of the
most powerful (and underused) tools available to traders. These
measurements are of great use with any market that is reasonably
liquid. |

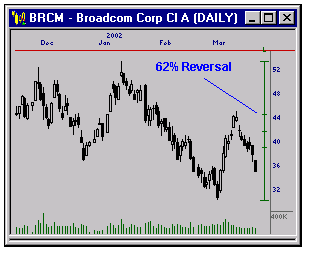
Broadcom shows a nice example of a reversal at 62% of the
previous trend

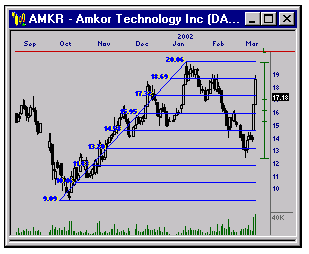
Another 62% reversal example for AMKR

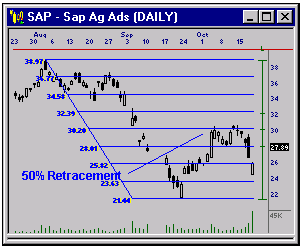
SAP shows a nice turn at the 50% retracement level
|
