Waiting for the Setup to Complete Results in ProfitsThere are various chart patterns that help us find good reversal candidates. Of the major reversal patterns, the double top or bottom is not only one of the most recognizable, but also one of the most predictive. For our example, we will discuss a double top, but the rules apply inversely to a double bottom. A double top forms after a major trend. It is easily recognized as it forms an "M" at the top of a chart (or in the case of a double bottom, a "W"). When we analyze a chart that appears to give us a double top formation, it is important to remember the following rules: 1. The first top is the highest point of the
current trend. Price retreats to form a valley, and then runs up
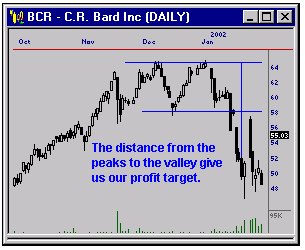
again towards the first top. Once price penetrates the valley of this M formation, we not only have our entry signal, but our loss stop and profit target are built into the pattern. The support that was created by the valley now acts as resistance, and we can set a stop just above this level to minimize losses should it reverse again. Measuring the distance from the peaks to the valley, and then applying that measurement from the broken support level downward can derive our profit target. This is illustrated in the chart for BCR. The most common mistake made is to jump too early on a potential double top or bottom. Unless price breaks through the support created by the valley (in the case of a double top), we could be merely looking at a period of consolidation occurring. Improve your odds of entering a winning trade by allowing the setup of this formation to complete before "pulling the trigger".
|

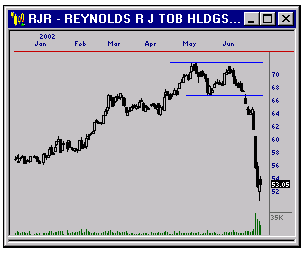
Big move after price breaks support for RJR.

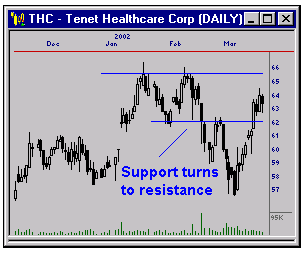
THC retraces to the new resistance level before realizing
the profit target.

The profit target calculation is built into the chart
pattern when double tops occur
|