As Technical Trader many Corporate Doctor Customers use the Guppy û Multiple Moving Average (GMMA) systems to determine market timing. Here are some more insights on current market direction by reference to the XJO index. As at 10 March 2009
We use the S&P ASX 200, or XJO, because this is the benchmark index followed by fund managers and institutions. The All Ordinaries is a popular headline figure, however it is the XJO that underpins professional assessment of the market.
What is a GUPPY MULTIPLE MOVING AVERAGE (GMMA)
À These are two groups of exponential moving averages. The short term group BLUE is a 3, 5, 8, 10, 12 and 15 day moving averages. This is a proxy for the behaviour of short term traders and speculators in the market.
À The long term group RED is made up of 30, 35, 40, 45, 50 and 60 day moving averages. This is a proxy for the long term investors in the market.
À The relationship within each of these groups tells us when there is agreement on value - when they are close together - and when there is disagreement on value - when they are well spaced apart.
À The relationship between the two groups tells the trader about the strength of the market action. A change in price direction that is well supported by both short and long term investors signals a strong trading opportunity. The crossover of the two groups of moving averages is not as important as the relationship between them.
À When both groups compress at the same time it alerts the trader to increased price volatility and the potential for good trading opportunities.
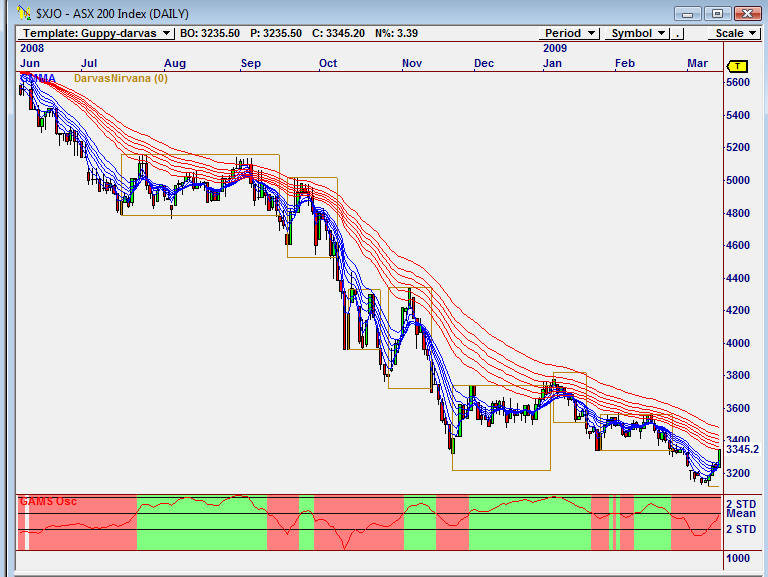
What is this chart telling us? We know the market is still falling. But the recent small scale recent rally is a rebound away from the downtrend line. The rally may move up to the lower level of the long term GMMA just above 3300. However this is a significant resistance level. The true support is found in the projection of the downtrend line.
The dominant market situation is weak rallies, and strong downtrend pressure. This creates a vulnerable market which can move quickly to the downside towards below 3000.
The long term GMMA remain well separated and this suggests investors are still sellers. They will aggressively sell into any rally that develops. The market is likely to experience increased volatility with sharp rallies and retreats. The market is defined by false rallies, dead cat bounces and rebound failures.
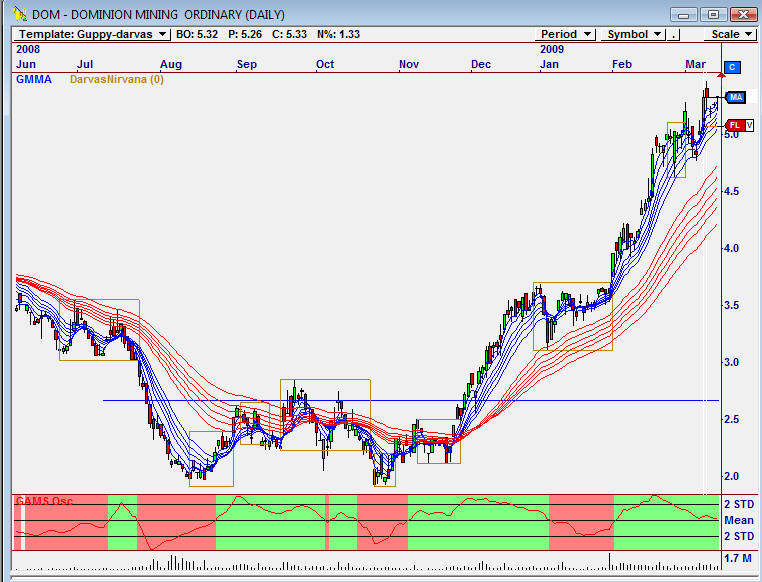
However there are individual shares which shine out in some sectors and show the opposite situation. OmniTrader will help you find these on a daily basis. Dominion Mining is such an example and trading over the last few months would have been successful as shown in the following example.
Click here to read more on this trading system http://www.corporatedoctor.com.au/pages/buy/paypal_duo.html