Review previous Australian analysis here - Learn more about Guppy Charts and this strategy within OmniTrader
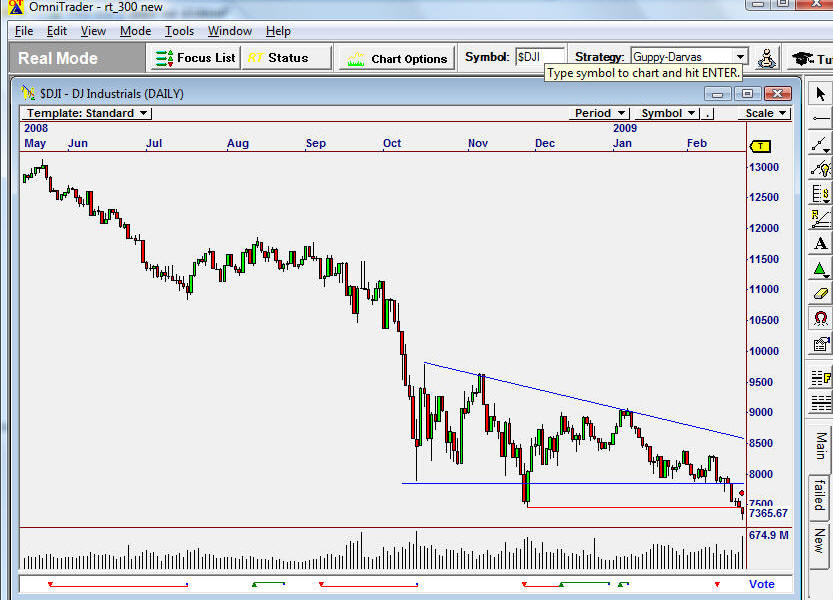
This pattern is seen in the America DOW Jones Index and it sets a downside target near 5600. This rapid fall below 7800 confirms this target. This chart pattern develops when there is a well defined support level. Above the support level is a down sloping trend line. The support level is created by the people who want to buy shares. When price falls to this level buyers enter the market.
The down sloping trend line is created by people who own the shares. They are worried about the future so they are ready to sell. When each new rally fails to move higher these shareholders lower the price they want for their shares. The result is shown as a down sloping trend line.
Over the last five months the rally rebounds developed a pattern of declining highs. The failure of the early 2009 January rally near 9000 established a second calculation point for a new trend line. The first calculation point for the trend line was set by the rally peak near 9600 in 2008 November.

Using chart pattern analysis, the downside target for the DOW Jones Index is near 5600. The long term historical support level is near 5500.
This combination of factors suggests there is a high probability the market will quickly fall towards support between 5500 and 5600. This is a 47% fall from the peak of the Index in 2007, October at 14198. This degree of fall is similar to the degree of fall in 1929 when the America market collapsed and developed the world depression. The market may develop a temporary rebound from below 7800. The market has two resistance barriers to defeat. The first is the strong support level near 7800. This is now a strong resistance level. The second resistance feature is the down sloping trend line. Currently the value of this trend line is near 8500.
The market must be able to move above this trend line to show any true bullish strength. The end of this triangle pattern develops near the end of 2009, April. There is a high probability the America market will develop a continuation of the downtrend with a slow move towards support near 5600.
There is a high probability Australia will follow.
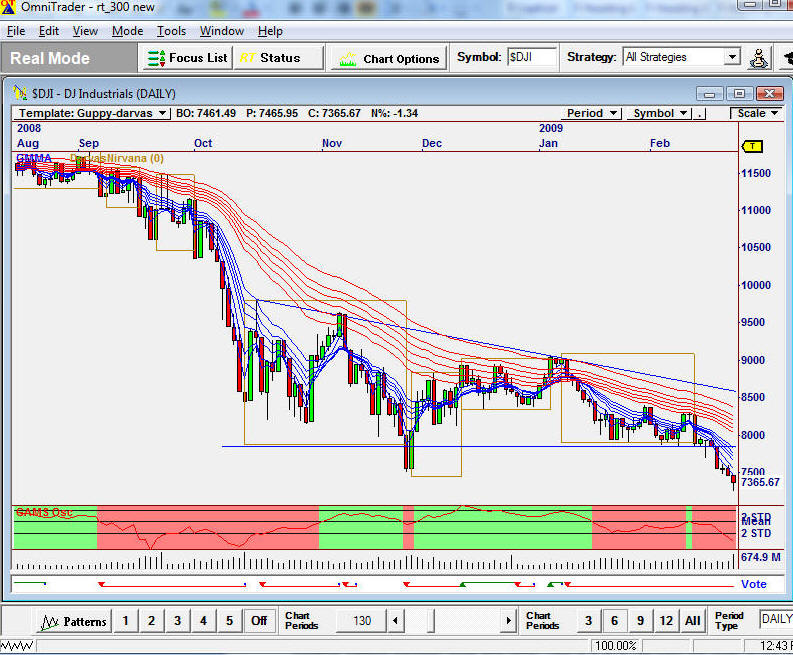
The following is the same DOW chart with Guppy-Darvas indicator displayed and showing just the last 6 months
