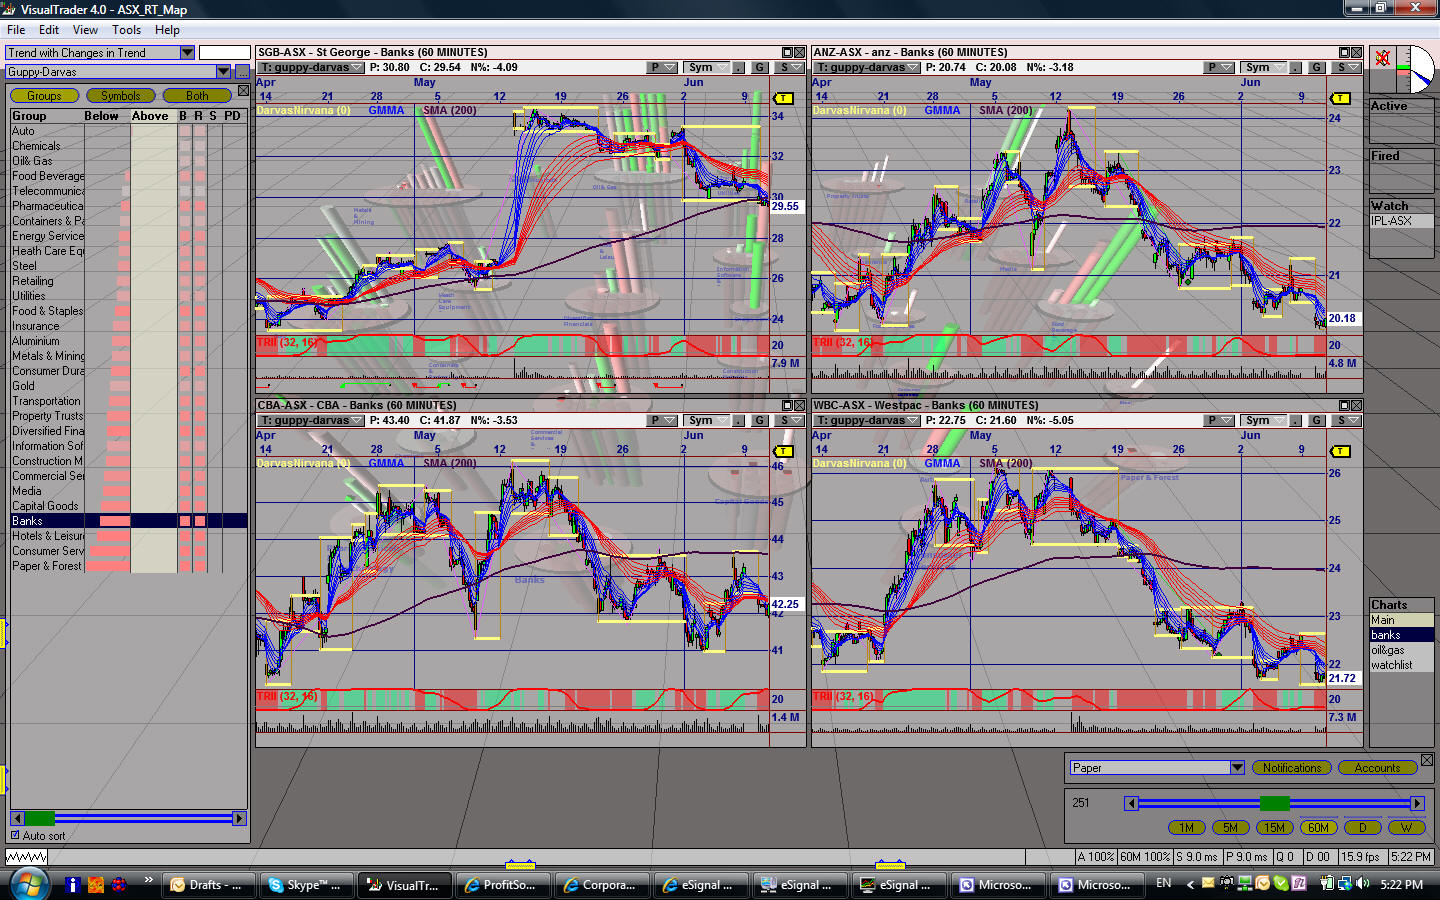
| VisualTrader [chart1]: Major sectors, Time frame = 60 minutes, Transform= Trending with change in Trend, Map sorted by largest trends down, and example of Bank sector and key shares |
|
|
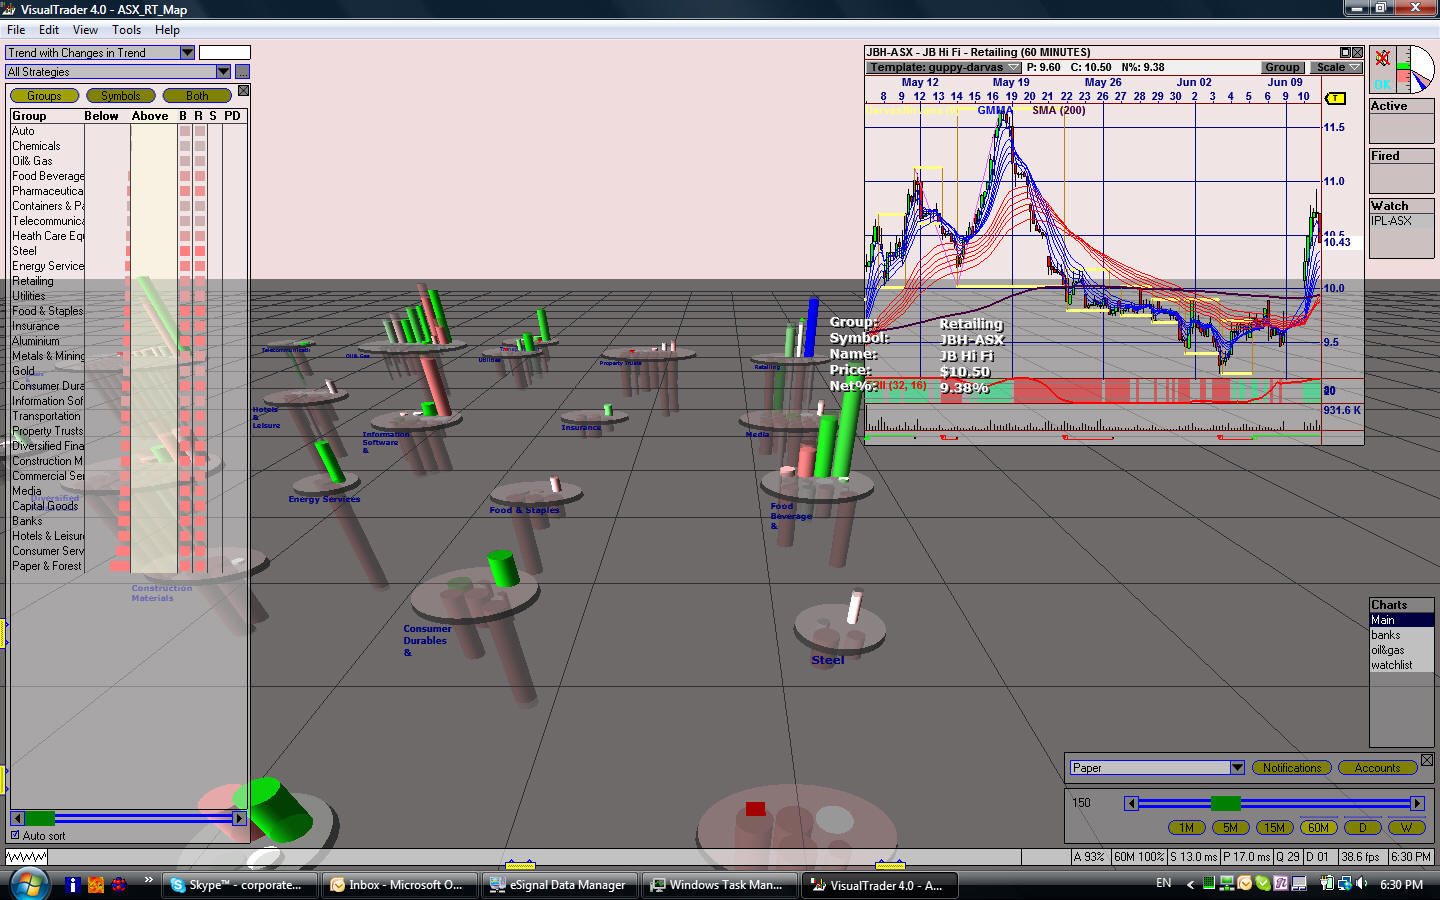
| VisualTrader [chart2]: the market may be down - but some shares did well - clicking on the bar in the retail group - showed JGB as going up 9% |
|
|