Are you getting the best out of OmniTrader?
Here are some screen examples showing a particular set-up for mechanical trading along with several charts to highlight the results.
-
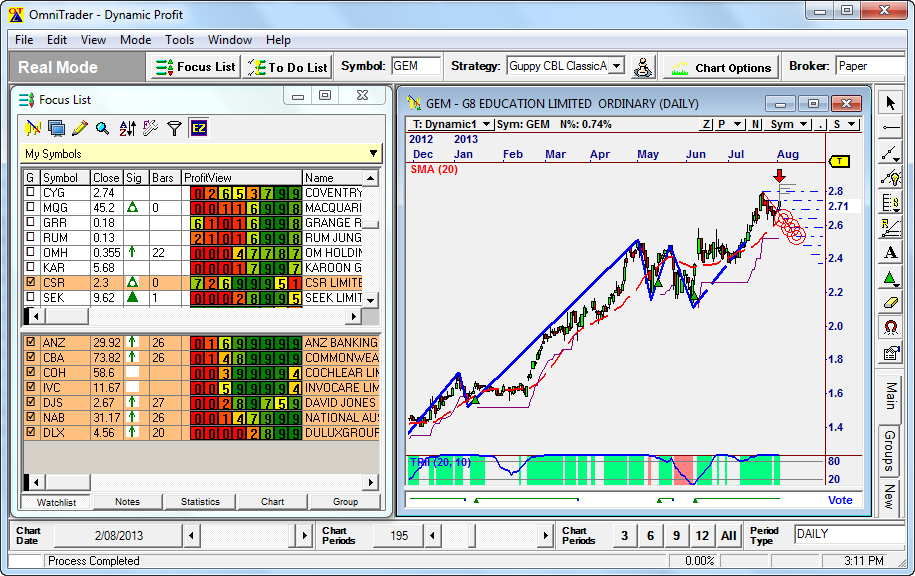
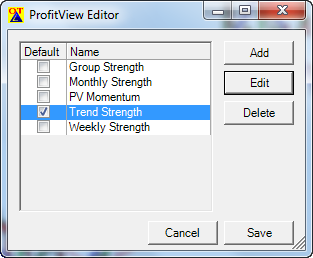
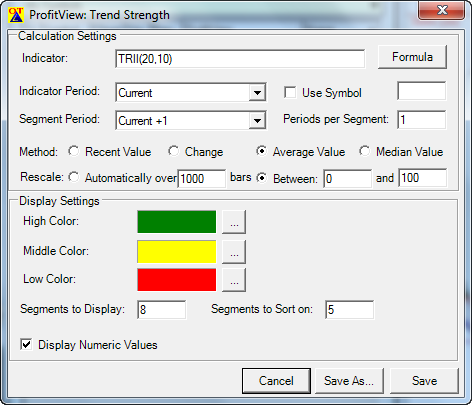
The Focus list on the left uses Profit View to analyse trends by activating a short period Trend intensity indicator- see below.
-
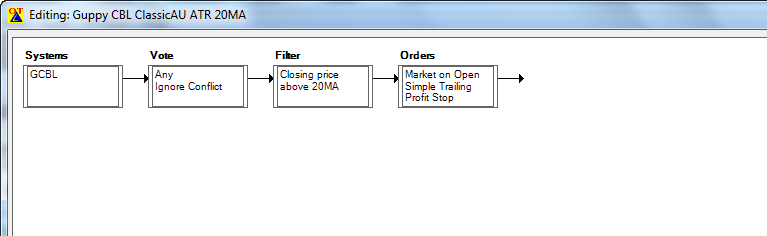
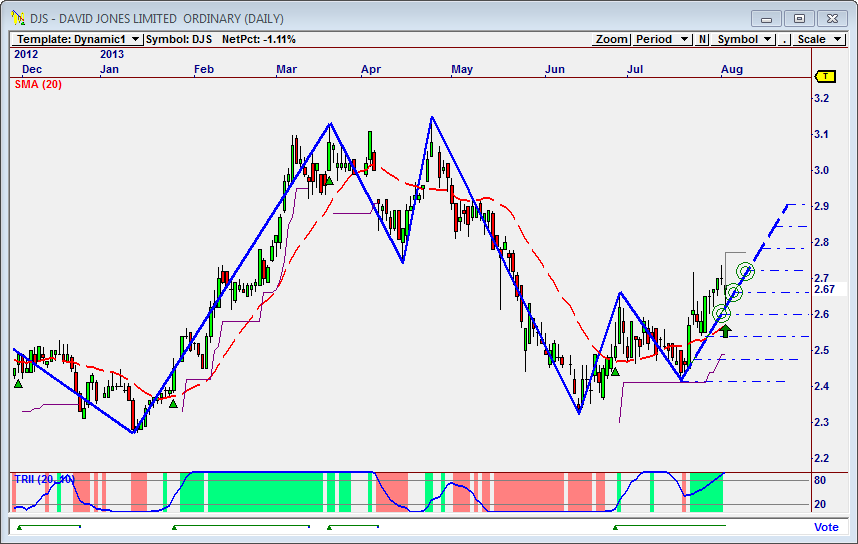
The strategy on the vote line is Guppy Moving Average there is a 20 day moving average filter (dotted red line) which requires the share to be trending up to generate a buy signal- see strategy below.
-
The chart uses the Dynamic Profit Module to forecast direction of share price - this generates a wave cycle prediction.
-
Everything on the chart including the price cycle line and the trailing stop are automatically generated
The first screen shows the Focus List and associated chart, then following are some chart examples using other shares
Trading in the direction of a strong trend reduces risk and increases profit potential.
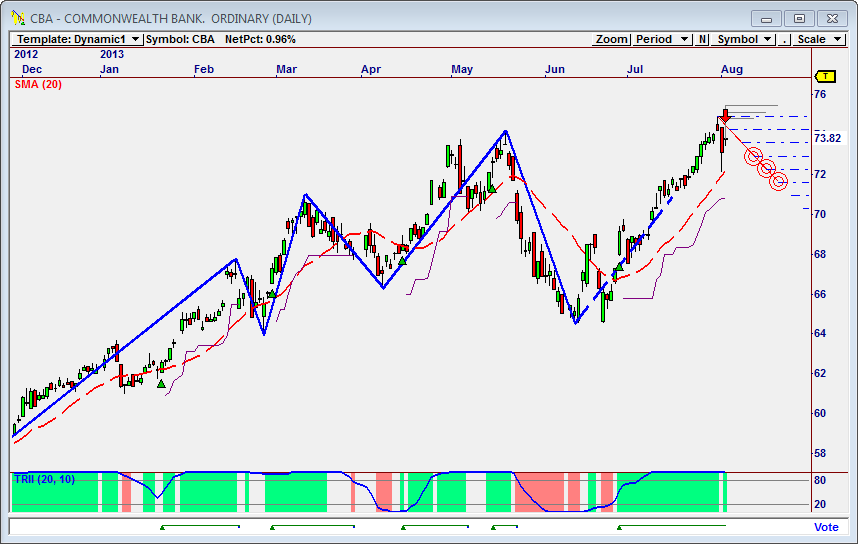
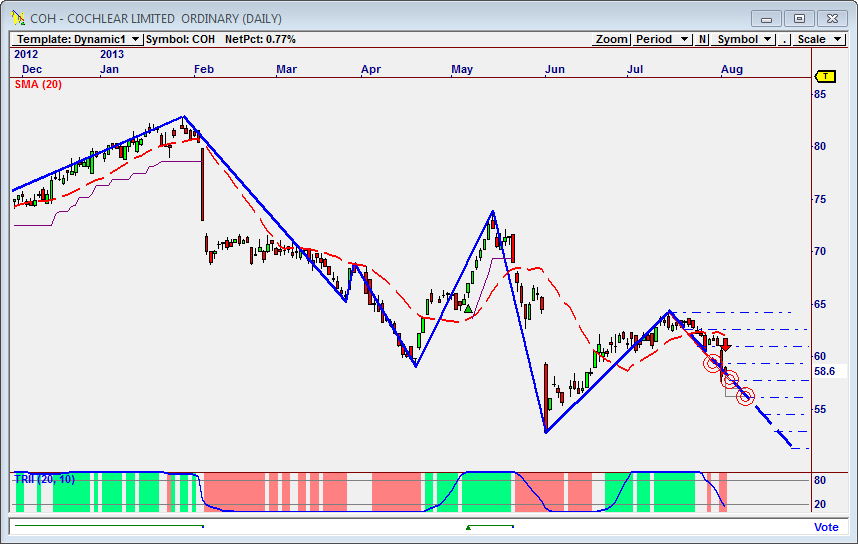
The TRII indicator (Trend Intensity Index) in this example uses settings such as TRII(20,10) for high sensitivity. Shows the direction of the trend up/down.
The Trend Intensity Index is used to indicate the strength of the current trend in the market. It is based on the premise that the stronger the current trend, the more likely the market will continue moving in the current direction. The TRII indicator can be used in a number of ways, including: A TRII value above 50 signals an uptrend; When TRII falls below 50, a downtrend is likely in place; a 50 represents a level that is trend-neutral; The closer TRII is to 100, the stronger the current uptrend and; The closer TRII is to 0, the stronger the current downtrend.
In the above examples you can see how the TRII indicator highlights the trend changes and helps determine market direction.