-
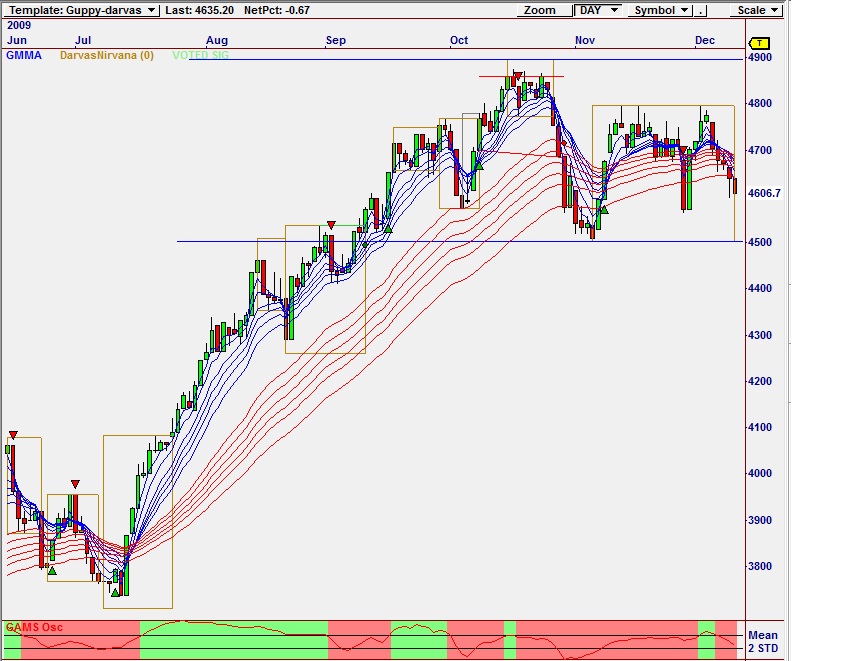
The analysis uses the Guppy Multiple Moving Average indicator for the XJO for the week ending 9/12/2009.
-
The S&P ASX 200/ XJO is used for market analysis because this is the benchmark index followed by fund managers and institutions.
-
The All Ordinaries is a popular headline figure, but it is the XJO that underpins professional assessment of the market.
-
This is essential reading for Traders who use Guppy and Darvas systems.
XJO Index - Consolidation Rally and Retreat
Here are the insights.
The long term uptrend line has a value near 4550. The support level has value near 4500. The market continues to fall towards these support levels. A rebound from the long term trend line is mildly bullish. It suggests the market can develop a longer term uptrend.
A fall below the trend line and a rebound from the support level near 4500 confirms the development of a sideways consolidation pattern. This presents short term rally trading opportunities. It also signals caution with those stocks that are developing consolidation patterns. These are potential end of uptrend signals because there is no guarantee the trading band breakout will be to the upside.
The market is moving sideways with a downwards bias. The potential lower edge of the trading band is near 4500. The upper resistance edge is near 4900. This is a trend correction in time. The trend correction in price was the fall from 4900 to 4500. This was an 8% correction, less than the 12% we had anticipated.
The XJO activity is favouring the development of a consolidation trading band rather than a continuation of the uptrend. Support near 4500 has not been tested. This market requires caution until a clear trend direction is established.
The consolidation band includes rally and retreat behaviour. Support is near 4500 and resistance near 4900. This gives an upside target near 5300 and a downside target near 4100. There is now a trend correction moving sideways for several weeks until the long term trend line is tested. This behaviour is consistent with the development in other markets.
Up trend continuation is shown when the market moves above 4900 and then retreats and uses 4900 as a support area for another rally rebound. The 5000 level provides a psychological barrier so there is a higher probability of some trend consolidation in this area. A move above 5000 is the most bullish outcome.
A trade band develops when the market retreats from 4900 and retests the new support level near 4550 to 4600. A successful retreat and retest signals a sideways consolidation pattern. This provides rally and retreat trading opportunities but it does not develop strong trending behaviour. The width of the trading and is used to project upside breakout tartest. The width of the trading band is also used to set downside breakout targets.