|
Multiple Timeframe Confirmation, or MTC is not a new concept but it is a method that is gaining more and more favour with traders in both end of day and real time trading.
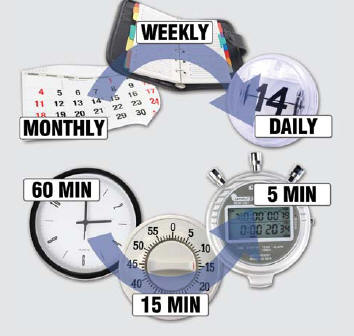
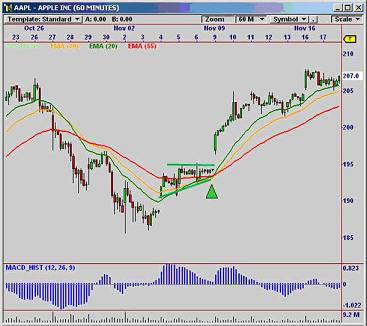
MTC is the art of finding trading opportunities characterized by bullish (or bearish) chart dynamics in timeframes other than the primary one the trader is using. If I am trading in the daily chart I might look at the weekly and 60 minute chart to see what the market looks like in both the longer and intraday timeframes. Using MTC, we identify a trading signal in the dominant timeframe we are trading, and then confirm it across the other timeframes. Let’s say I am an end of day trader, using Daily Charts. I might be running a simple MACD system to look for reversals. When I see a trading signal, I look at the weekly chart to see if there is a bullish pattern in that timeframe. Assuming there is, I then look at the 60 minute chart to see what happened in the last 4-5 hours of trading. If there is bullish sentiment in that timeframe as well, I enter my trade and go back to the Daily chart to manage it. When examining a HIGHER timeframe, we are looking for longer term support and resistance and (optionally) bullish indicators in that timeframe. The idea here is to determine whether we are near a significant level in the longer term chart that might affect our trade, since the psychology of the market could easily be affected by, say, a support level going back as far as even a few years. If Stock ABC has hit $20 four times in the last year and rallied, you probably don’t want to be shorting it at $20.50. Similarly, if the stock is breaking through $30 in the daily chart but the weekly or monthly shows all-time resistance at $31, you probably want to wait until $31 has been surpassed before buying it. When we examine a LOWER timeframe, we are looking for shorter term chart patterns – especially Consolidations, Saucers, and Gaps. This is the most important aspect of MTC because confirming that you have a bullish chart pattern in (say) the 60 minute chart means your end of day trade has that much more chance of rallying at the open, giving it that much more clearance from your entry. Chart patterns provide one level of MTC confirmation, but you can also use indicators. Whether you are trading with moving averages, RSI, Stochastics, MACD or any other basic movement indicator, seeing the values above and below your trading timeframe provides an extra level of confirmation. For example, a rising MACD Histogram indicates strength. If we plot this indicator in multiple timeframes, and confirm that it is rising in each of them, we have further increased the chance of an upside move. Three charts are presented below – a daily, weekly, and 60 minute chart for AAPL (Apple) , depicting what happened on November 6 and 9. Weekly: In the weekly chart, we are turning up off a Cycle Low above our averages. Daily: On this “signal” day in the Daily Chart, MACD Histogram is increasing, we have a gap, and moving up through our moving averages.
60 Minutes: On November 6, we we were turning up off our moving averages. We also have a consolidation formed over the past 2 sessions. Consolidations are continuation patterns so this pattern indicates the probability of a continued up-move.
All three timeframes showed bullish sentiment. AAPL rose 5% to the end of November. MTC works because the participants in each timeframe have different trading horizons. In the daily chart, you primarily have short term investors with holding time horizons of 1-3 weeks. In the weekly chart, longer term investors are working to establish investments lasting months. Dropping to the 60 minute chart, you have the trading market acting on the stock during the session, creating a technical psychology that fuels movement.
When all three
participants (short, medium, and long term) are acting on a
stock to drive it up, the chance of continued rally in all
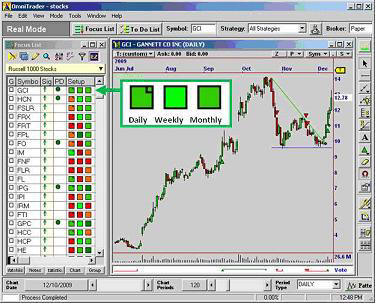
timeframes is increased. OmniTrader 2010 can show any indicators from multiple timeframes in the Setup column. A green square indicates a bullish movement in each timeframe, and red indicates bearish. Recent trading signals and chart patterns are also shown in the list.
OmniTrader 2010 shows indicators in multiple timeframes in its symbol list, along with trading signals and chart patterns (which appear as arrows in the Sig column and circles in the PD column). The Setup for chart above for GCI showed bullish sentiment in the Daily, Weekly, and Monthly charts at the same time. Summary Multiple Timeframe Confirmation is a powerful tool for confirming direction before entering any trade. Applying the principle of MTC can dramatically improve your results. If you display charts in several timeframes at the same time and confirm across them, you will definitely gain an edge in your trading. |