"Two Major Technical Forces Are About to Collide in the S&P 500" - does this have relevance to Australia and may be a warning??? Watch the video here
http://www.ino.com/info/449/CD3960/&dp=0&l=0&campaignid=3
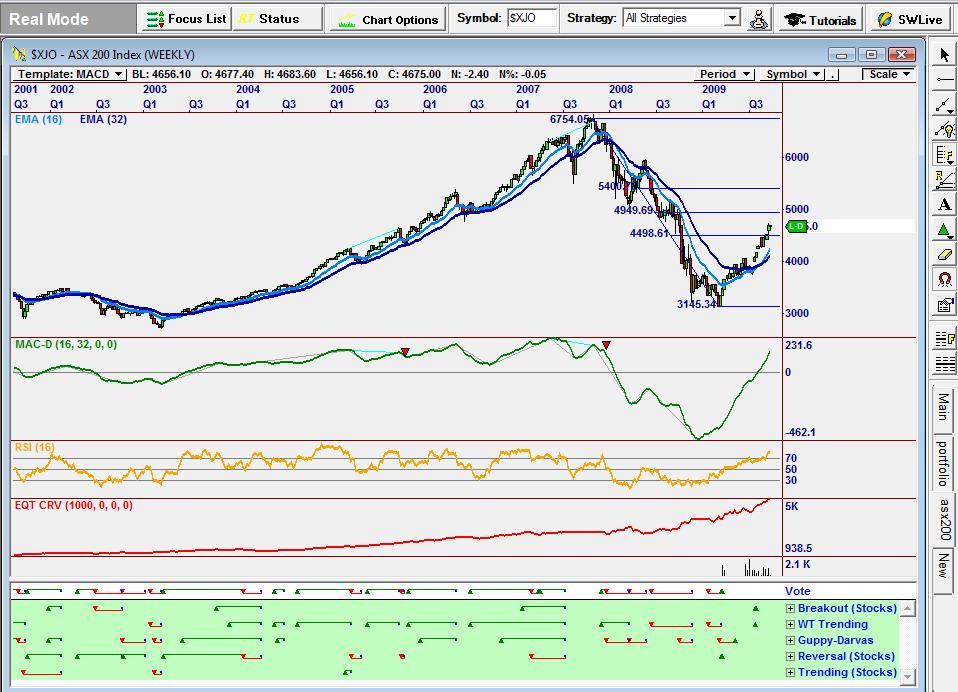
Following is the equivalent ASX (weekly) chart discussed in the video – including the Fibonacci chart. The chart includes two moving averages , the MACD, RSI, plus an equity curve to show the quality of the trading results over the chart life (based on the strategies shown below the vote line).
To learn more about Moving Averages click here