ProfitView can be used to sort your share lists to highlight changes in the trend of indicators.
Trading in the direction of a strong trend reduces risk and increases profit potential
In the following examples we only want to trade shares where the the ProfitView history shows green and is rising.
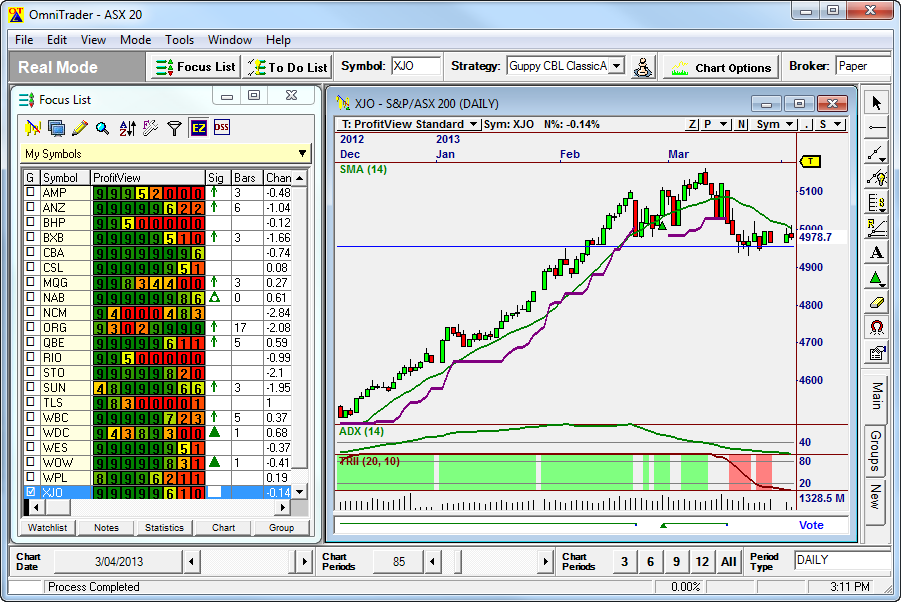
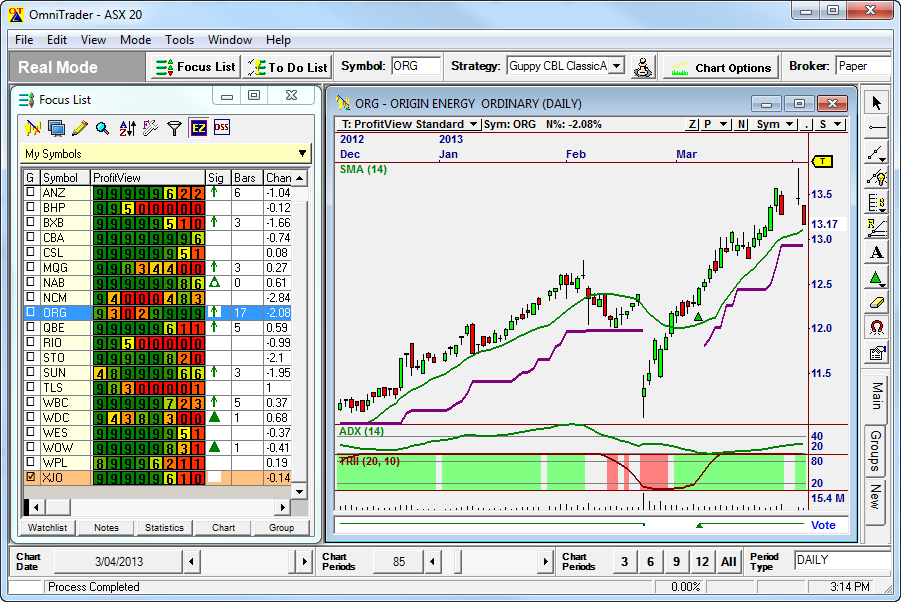
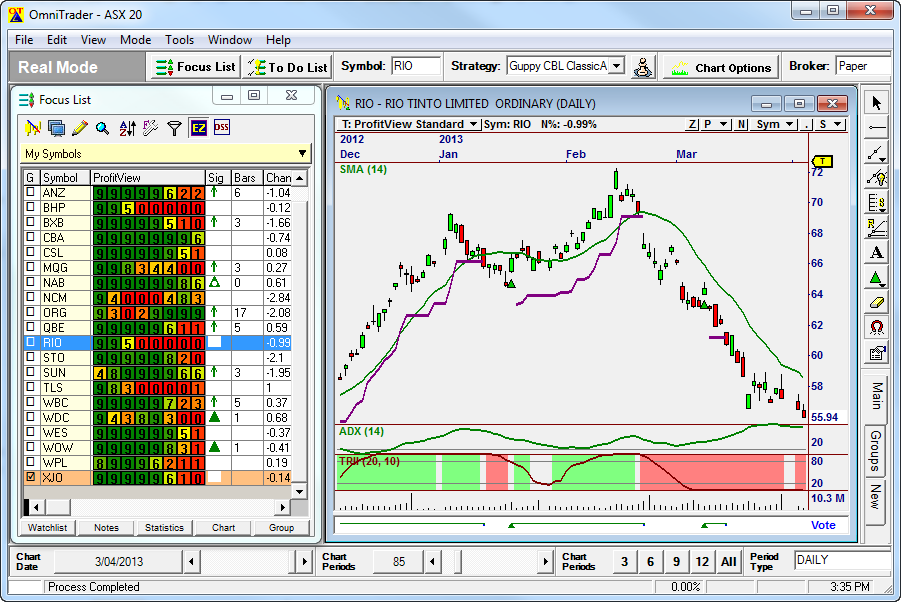
The following three example screens show the XJO index, and ORG (a good trend performer) + RIO (a poor trend performer) - all extracted from the top 20 list.
On each chart you will see
(1) a 20 day moving average - some users adopt the rule that they only buy if the share and the XJO is trading above the 20 day Moving Average.
(2) the trailing exit stops using Guppy Moving Average strategy (in this example we are using an ATR= 2.5 as the trailing stop), and
(3) at the bottom of the chart there are two indicators the ADX (a fast trending indicator) and TRII (a slower trend intensity indicator).
Only the TRII indicator has been used in the Profit View schedule to highlight the trend movement - the focus list can also be sorted - the key point is that Green is an uptrend up and Red is down trend where 9 is good and 0 is bad. This example uses TRII and it could have been sorted in order best to worse. We have used TRII but any indicator can be used.
Also note in the focus list that "Bars" tell you how long the Guppy Moving Average signal has been active and the last column is the % $change for today in the share price.
See below the three Charts an explanation of Indicators.
Click here to read more on ProfitView
Explanation
Trading in the direction of a strong trend reduces risk and increases profit potential.
The TRII indicator (Trend Intensity Index) in this example uses settings such as TRII(20,10) for high sensitivity. Shows the direction of the trend up/down
The Trend Intensity Index is used to indicate the strength of the current trend in the market. It is based on the premise that the stronger the current trend, the more likely the market will continue moving in the current direction. The TRII indicator can be used in a number of ways, including: A TRII value above 50 signals an uptrend; When TRII falls below 50, a downtrend is likely in place; a 50 represents a level that is trend-neutral; The closer TRII is to 100, the stronger the current uptrend and; The closer TRII is to 0, the stronger the current downtrend.
In the above examples you can see how the TRII indicator highlights the trend changes and helps determine market direction.
Also Plotted as an example but not used in the ProfitView list is the ADX indicator.
The ADX is used to determine when price is trending strongly.
ADX is used to quantify trend strength.