| Group Trader
|
 |
 |
 |
 |
 Download a
Brochure Download a
Brochure |
|
Australian User note |
- Group Trader was developed to work with OmniScan and the US Markets where you can access additional fundamental data
not available for Australian Shares within OmniTrader.
- However it can be used in Australia
(review examples below)- you will need to
create your own groups/sectors and then you can examine
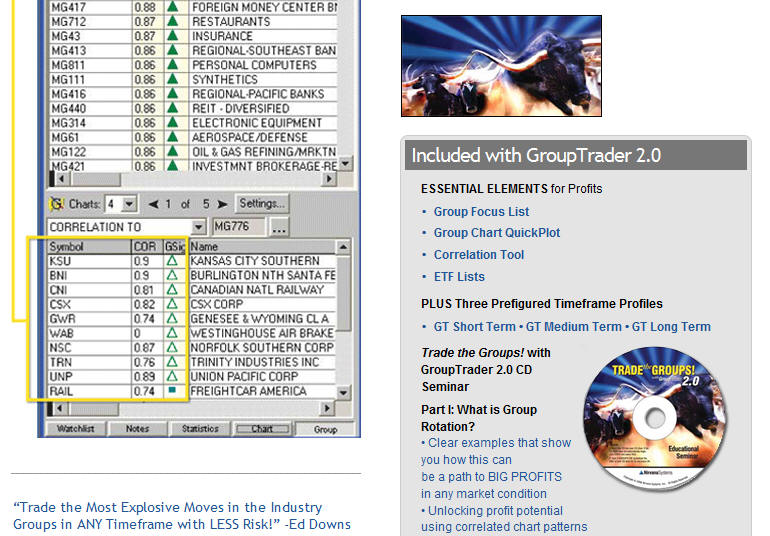
the main three relationships which are "Correlation" , "Beta" and "Relative Strength"
to any other share or to the group
- The main idea is to obtain signals
by using the group relationship to find opportunities
- It runs in End of Day mode only
|
|
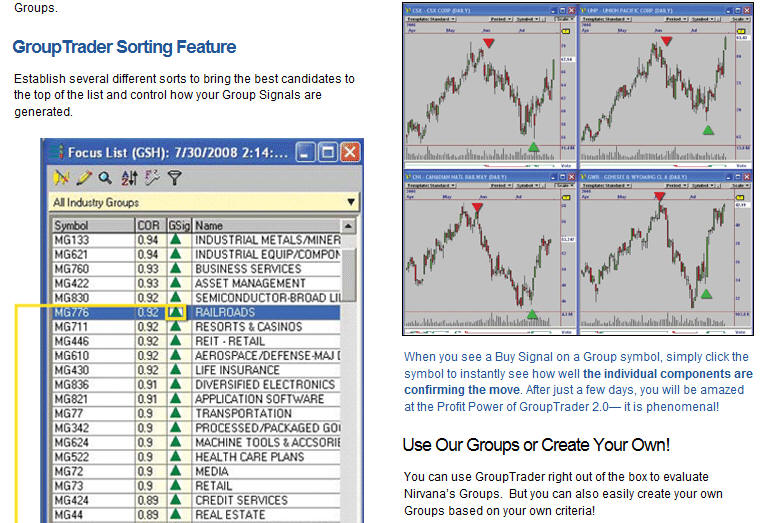
Example of the Groups set up for Australia and the Correlation run
for Banks |
 |
|
|
|
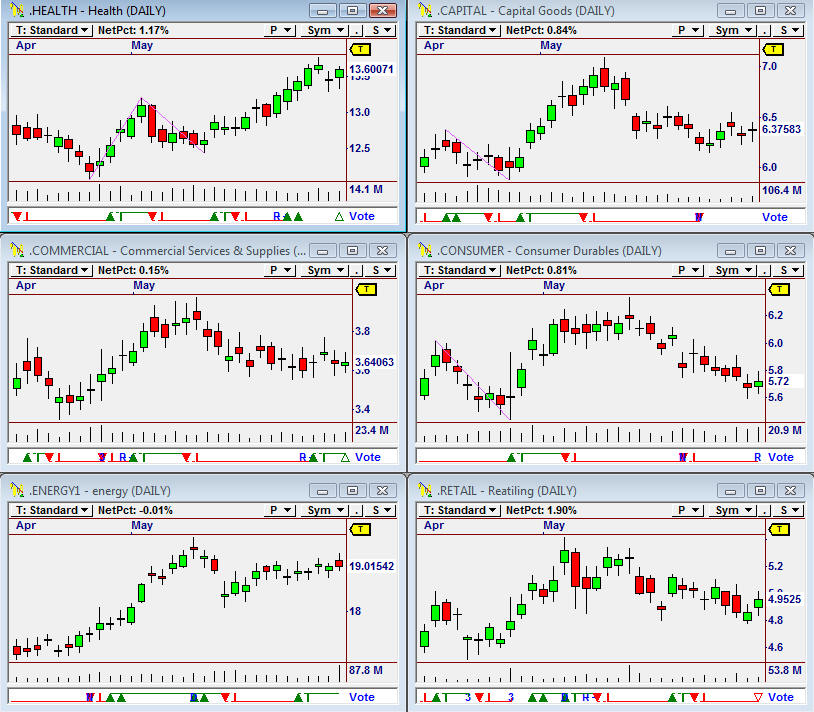
Example of some groups on one chart (showing daily group movements of
all shares + price change for whole group) |
 |
|
|
 |