| NSP41 Tests |
 |
|
Return to menu |
|
The following analysis was carried out in the
Australian Market. We made several changes to the US version
including only allowing long trades. |
|
|
|
Performance Tests |
|
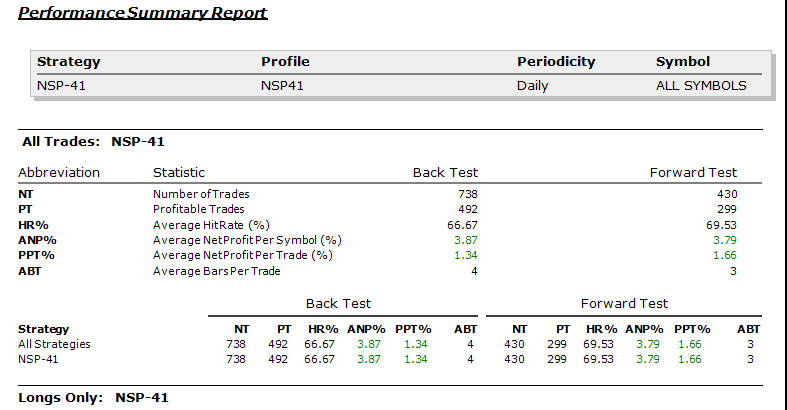
Using 750 period back test and 250 period forward test against the ASX
300. (Forward tests confirm the results of the Back test optimisation).
All trades analysed |
 |
|
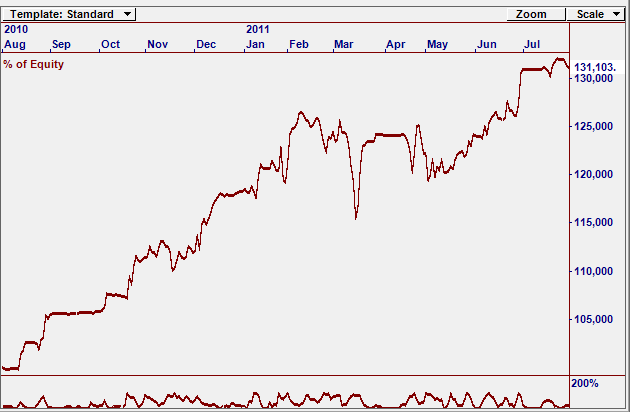
Equity Curve for the last 12 months |
|
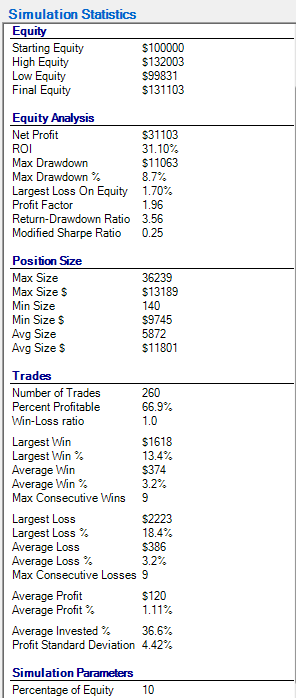
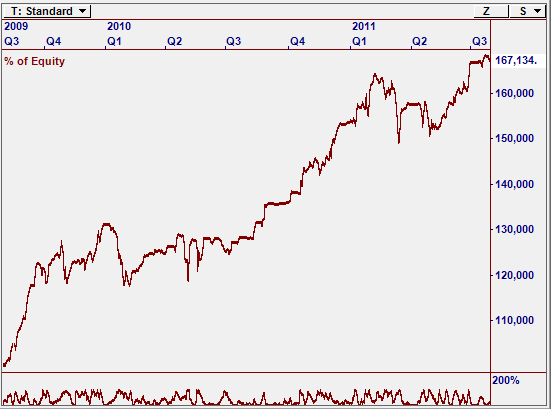
The return on equity ROI for 250 forward test
(live) is 31% for the ASX 300. This is when the ASX return for the last
12 months was NIL |
|
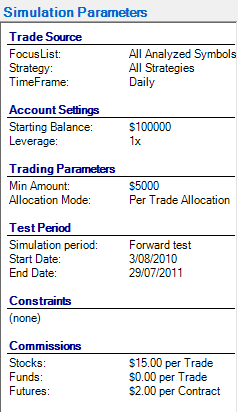
A minimum trade size of $5000 was set and
commissions of $15 a trade were assumed. This is an active
strategy with typical trades of 4 days or less hold period. In the
tests long trades were allowed to occur even when the market was down
from March. (and as you know, past
results are no guide to the future performance). |
 |
|
|
|
Assumptions for Simulation - & Portfolio Results
|
 |
 |
|
Equity Curve for the last 24 months ASX 300 -
67% ROI |
 |
|
|
|


